

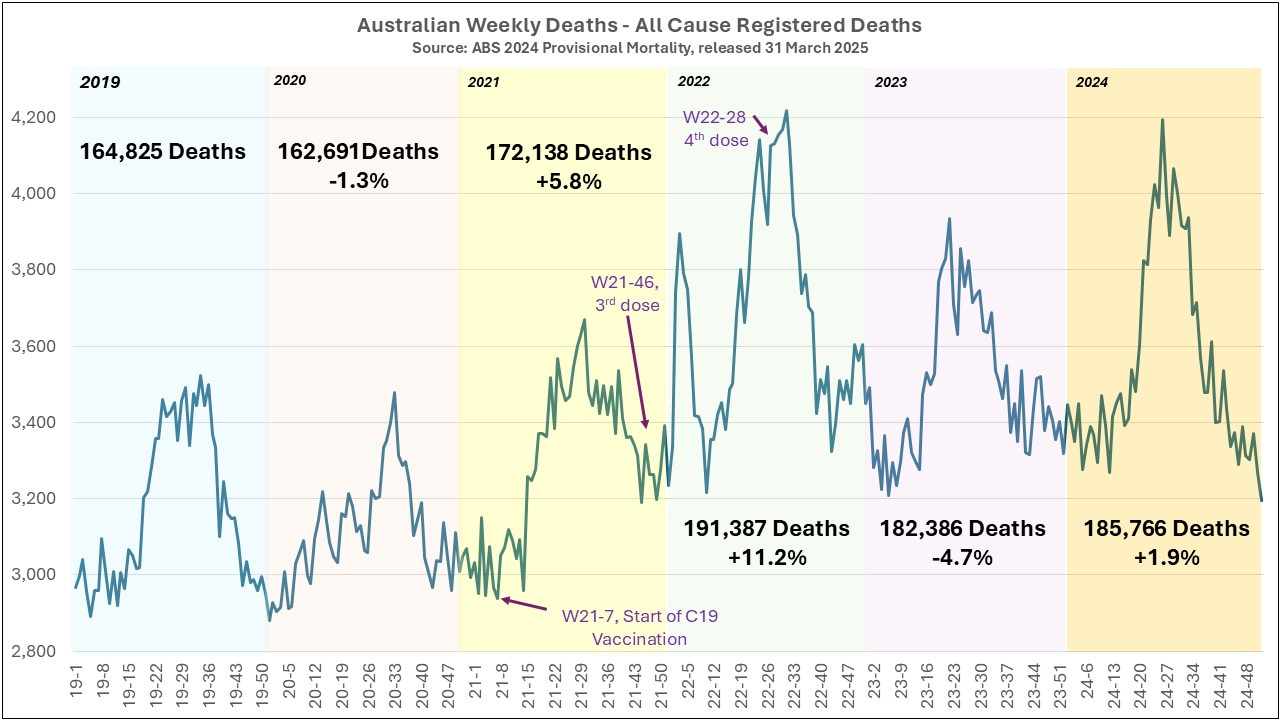
ABS Provisional 2024 Released on 31 March 2025. Overall Mortality is 1.9% Higher than 2023 and 12.7% Higher than 2019 Levels. By State Increases in Mortality Vary Widely.
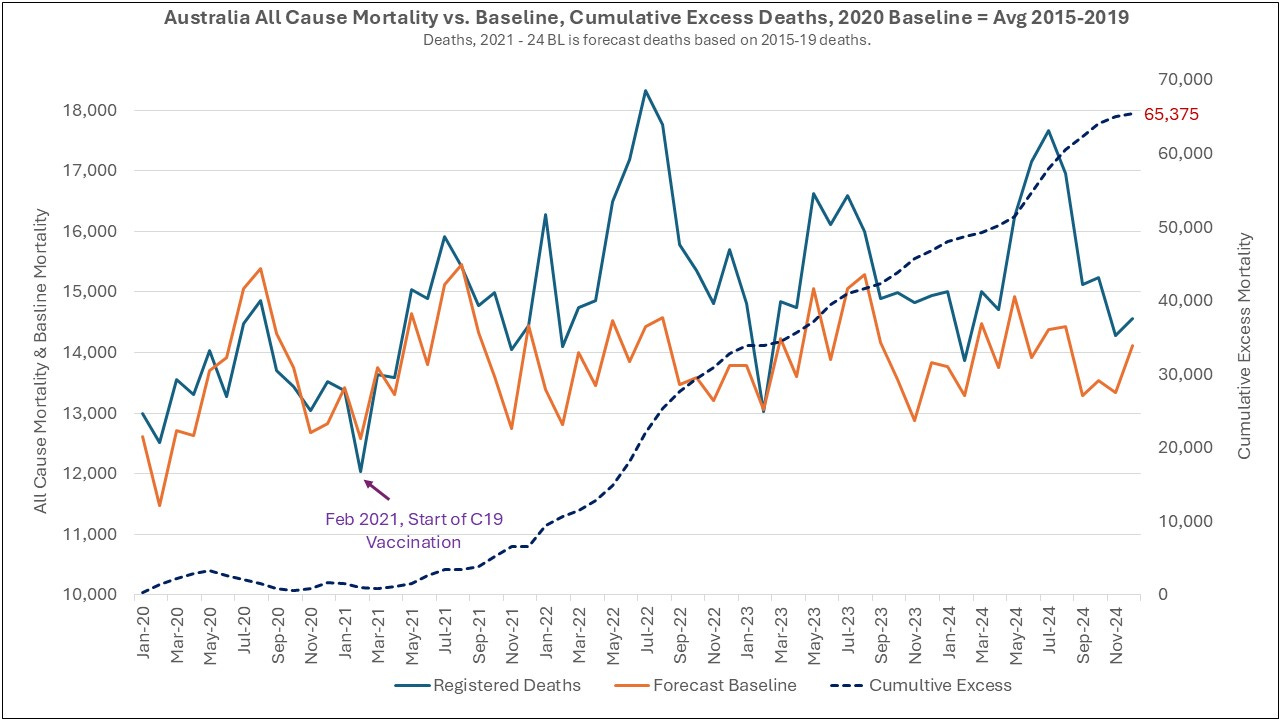
Cumulative excess mortality since 2020 rose further to 65,375, with overall excess for 2024 still 10% above forecast levels. Men fared worse than women and older folk worse than younger.

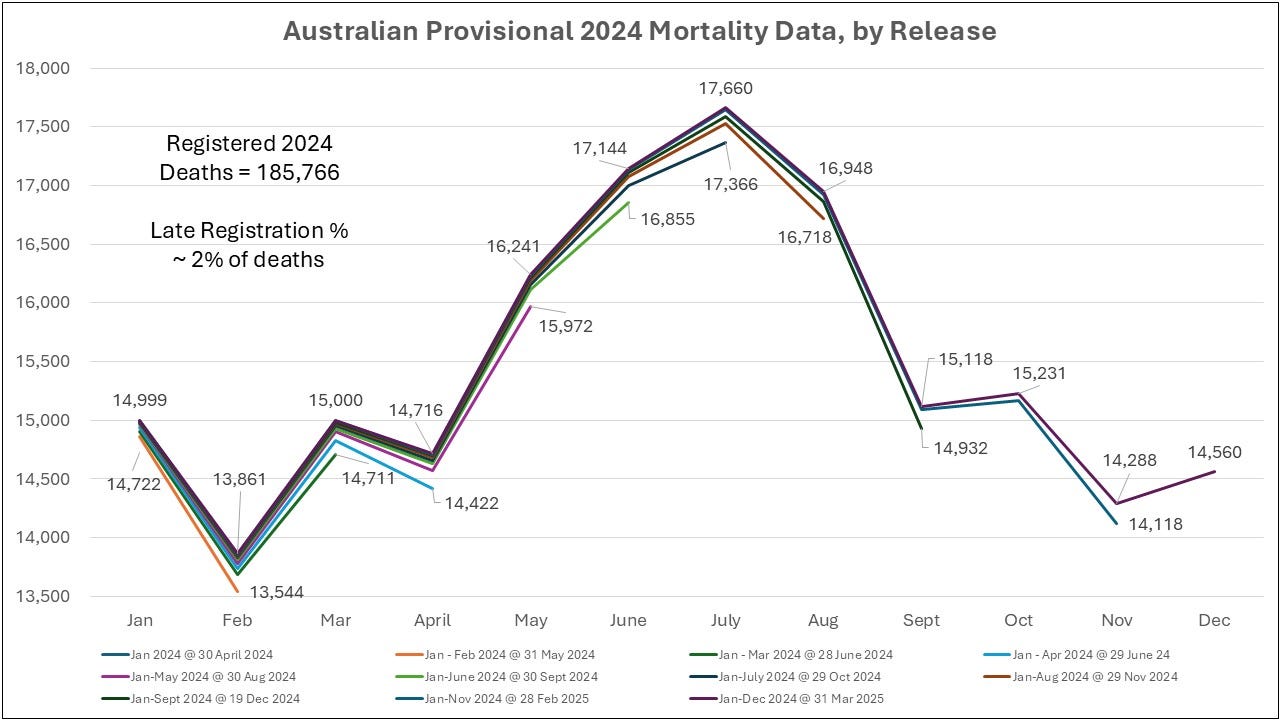
ABS has released its provisional 2024 Australian mortality data for deaths registered by 28 February 2025. Reference is only made to 2022 and 2023 deaths with 2024 deaths being overall lower than 2022, but higher than 2023. I provide comparisons with and discussions referring to pre-pandemic mortality patterns.

Typically, late registrations (deaths reported after ABS first report) account for about 2% of deaths. The 2024 total deaths may still rise, with that rise likely comprising at most 0.4% additional deaths to the 185,766 already reported, based on historical patterns of late registrations.
Plot showing Australian registered deaths since 2019. It is important not to forget what deaths patterns looked like prior to the pandemic! Deaths patterns changed considerably following rollout of the Covid-19 gene therapy products. Deaths in 2024 show a very distinct winter peak, indicating that vulnerable Australians cannot withstand the winter cold.
Covid-19 Vaccination in Australia
Covid-19 Vaccination with Comirnaty / Pfizer brand is still on offer, particularly targeting infants, pregnant women, immunocompromised people and the elderly.
The Australian Government Immunization Handbook currently recommends a single primary dose of Covid-19 vaccine for healthy unvaccinated adults aged 18 - 64. This group may consider annual dosing based on risk-benefit assessment. Adults aged 65-74 are recommended for an annual dose and may consider further doses every 6 months based on risk-benefit assessment. Adults aged 75 and above are recommended to receive a dose every 6 months.
Unvaccinated women are recommended to receive a dose during pregnancy, and vaccinated women may consider a further dose.
Children and adolescents aged 5- <18 years can receive a single primary dose.
Infants and children aged 6 months to < 5 years can receive 2 primary doses and consider a 3rd based on risk-benefit assessment.
Uptake is still ongoing, with the March 12 7-day rolling average being 4,286 booster doses.

The peak booster dosing in May 2024 was followed by peak Australian deaths in June 2024. Could that be related to elderly and vulnerable Australians having just received their Nth dose of Comirnaty?
Excess Deaths Vs. Forecast
Monthly expected deaths for 2020 through to 2025 were forecast using 2015-2019 historical data (excel forecast) and plotted. Deaths in 2024 are 10% higher than forecast levels, with cumulative excess deaths calculated to be 65,375. Deaths inflected in February 2021 with the start of rollouts and have not recovered.
Deaths by Australian State
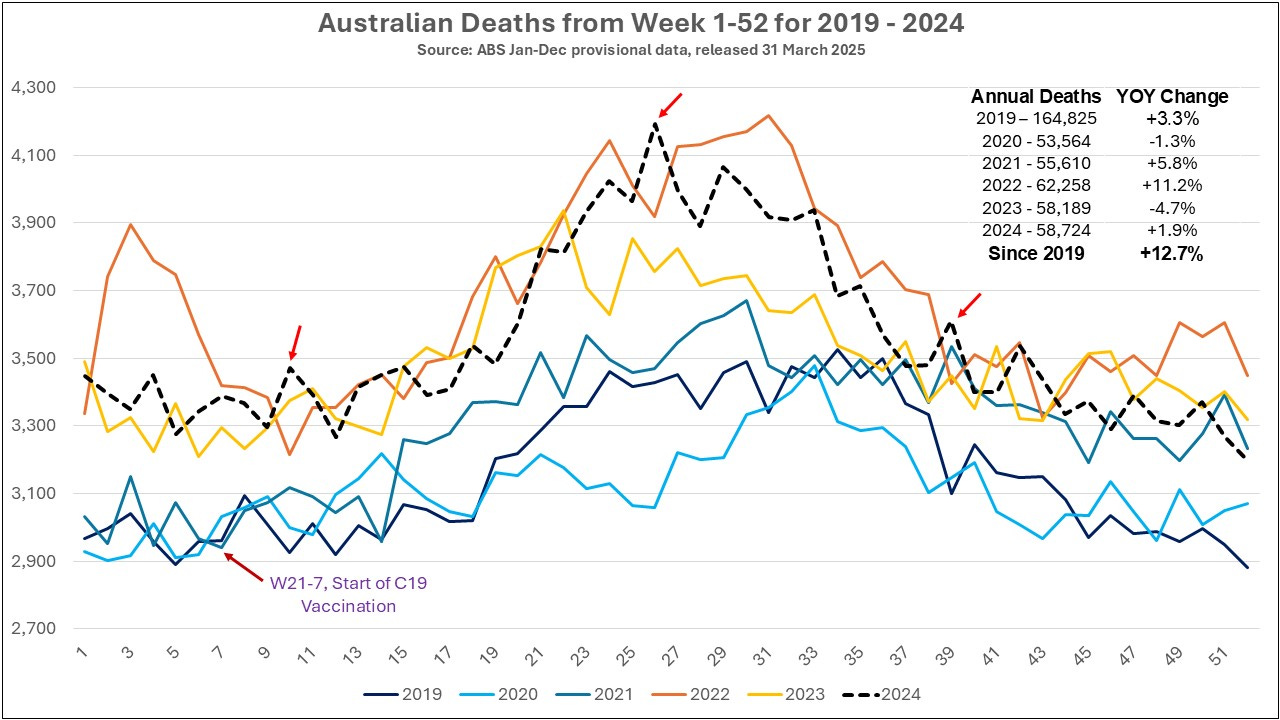
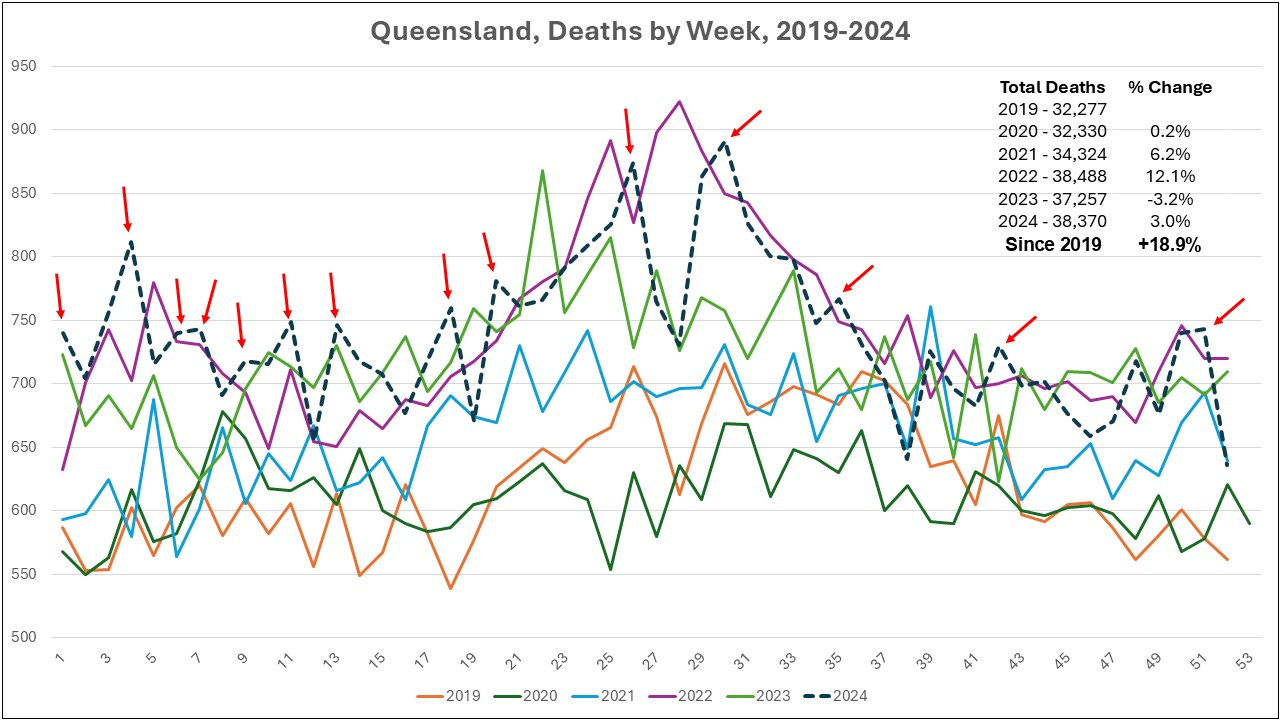
Deaths vary greatly by state over the pandemic years. Exploring these differences should be done by epidemiologists and social and population scientists. Overall Australian deaths have increased by 12.7% since 2019. Overall, 2024 had 3 weeks where deaths exceeded all prior levels.
Queensland, the Sunshine State, has the highest increase in deaths since 2019 of 18.9%. It has 15 weeks in 2024 where deaths exceed all prior levels.
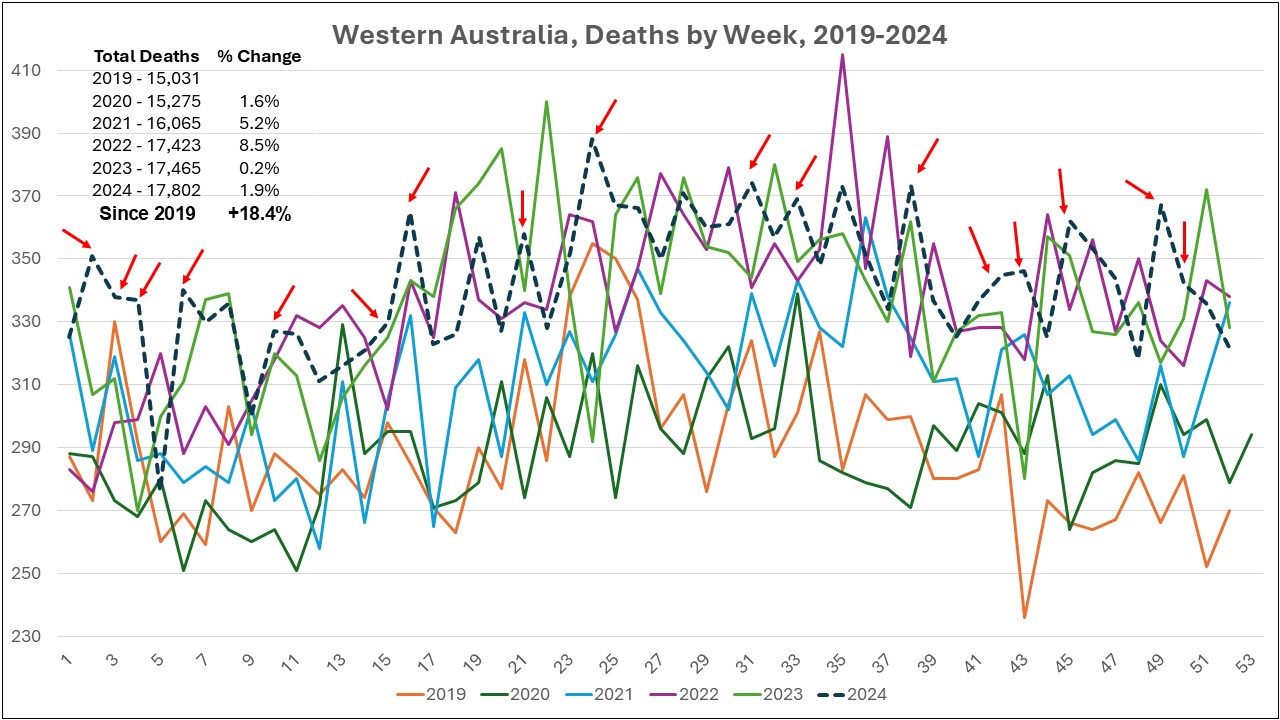
Western Australia, the hermit state which sealed itself from the rest of Australia during pandemic years, stands out with its uniquely continuous rising deaths. It has had an 18.4% rise in registered deaths since 2019. It has 17 weeks in 2024 where deaths exceed all prior levels, higher even than Queensland’s levels.
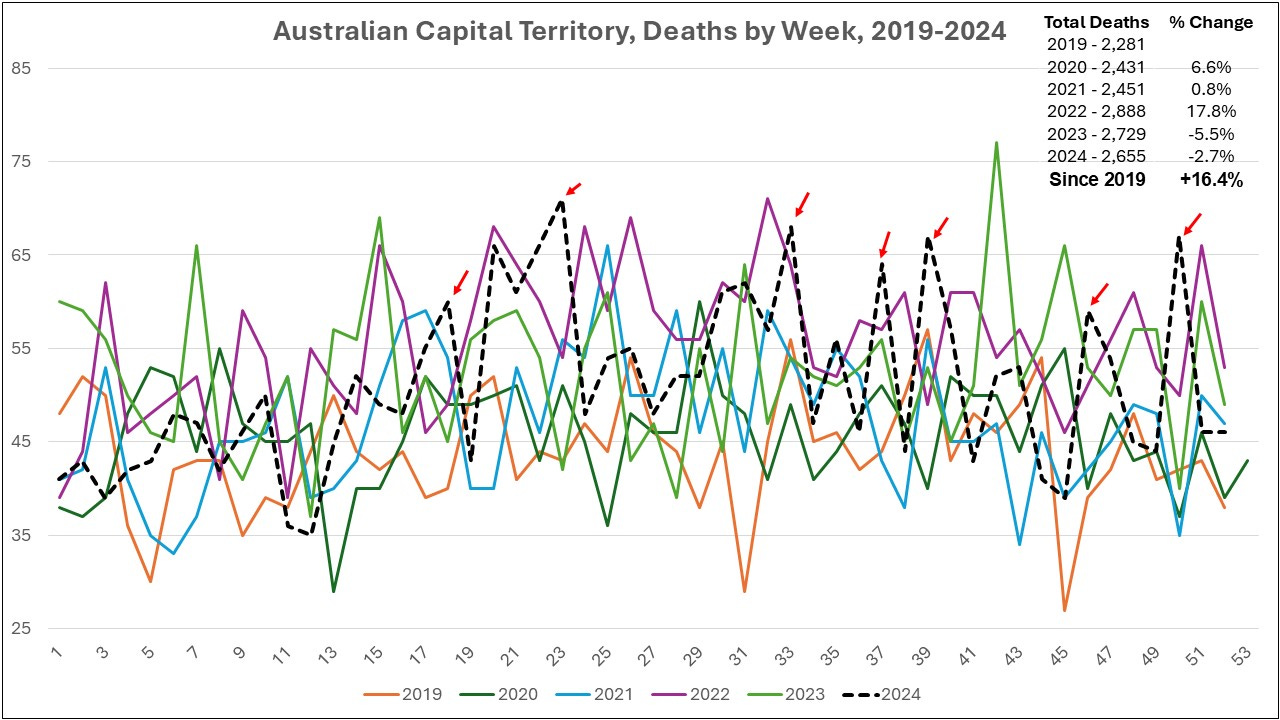
Australian Capital Territory, the home of Canberra the capital of Australia and seat of Government, has had a 16.4% increase in deaths since 2019. It has 7 weeks in 2024 with deaths exceeding prior levels. It is one of only 2 states to have dropping deaths in 2024.
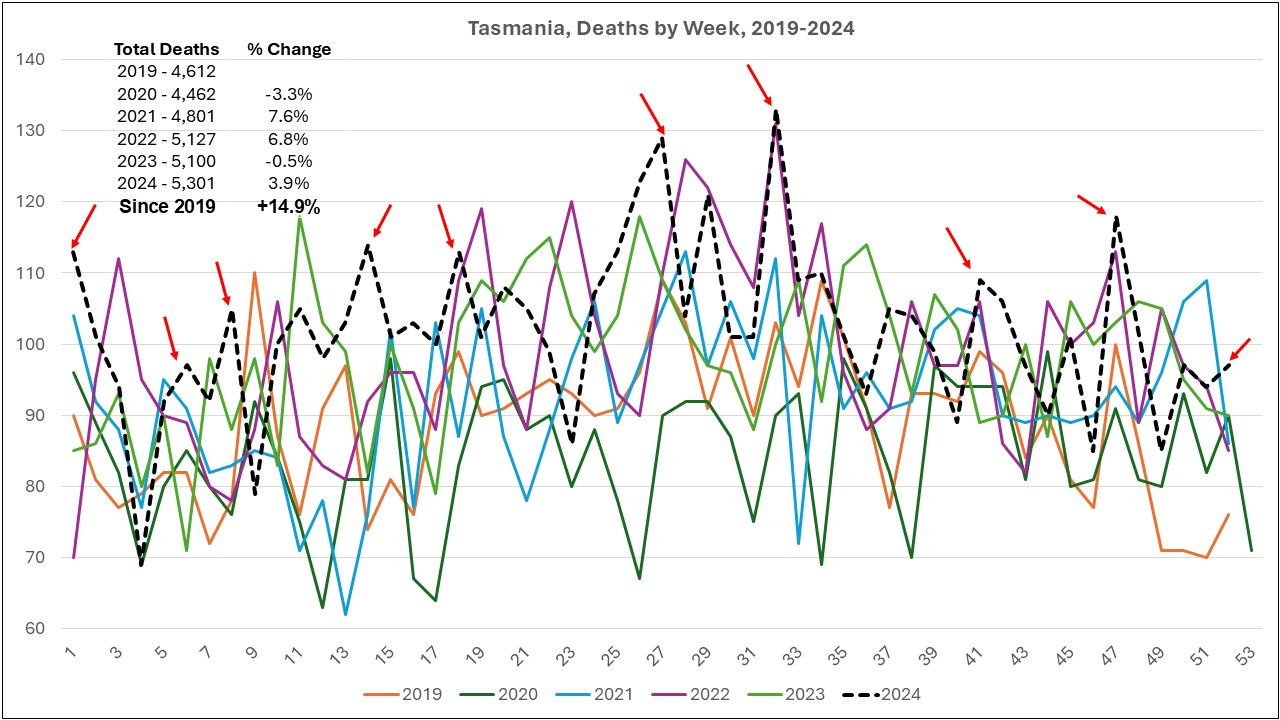
Tasmania, Australia’s southern-most and only island state, had a 14.9% increase in deaths since 2019. It has 10 weeks in 2024 with deaths exceeding prior levels. It also had the largest increase in mortality between 2023 and 2024 of all states.
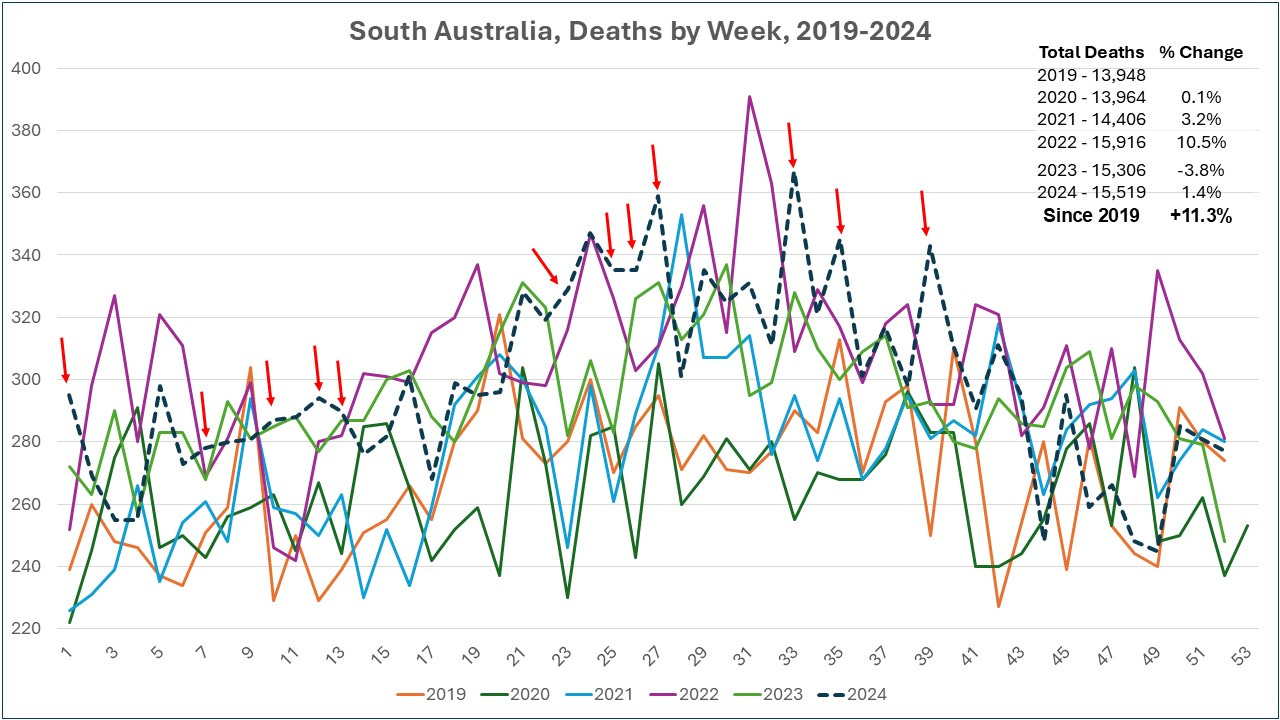
South Australia had a 11.3% increase in deaths since 2019. It has 12 weeks with deaths exceeding 2023 levels.
Victoria, which has about 26% of Australia’s population, has had a 10.3% increase in deaths since 2019. It has 9 weeks in 2024 with deaths exceeding prior levels.

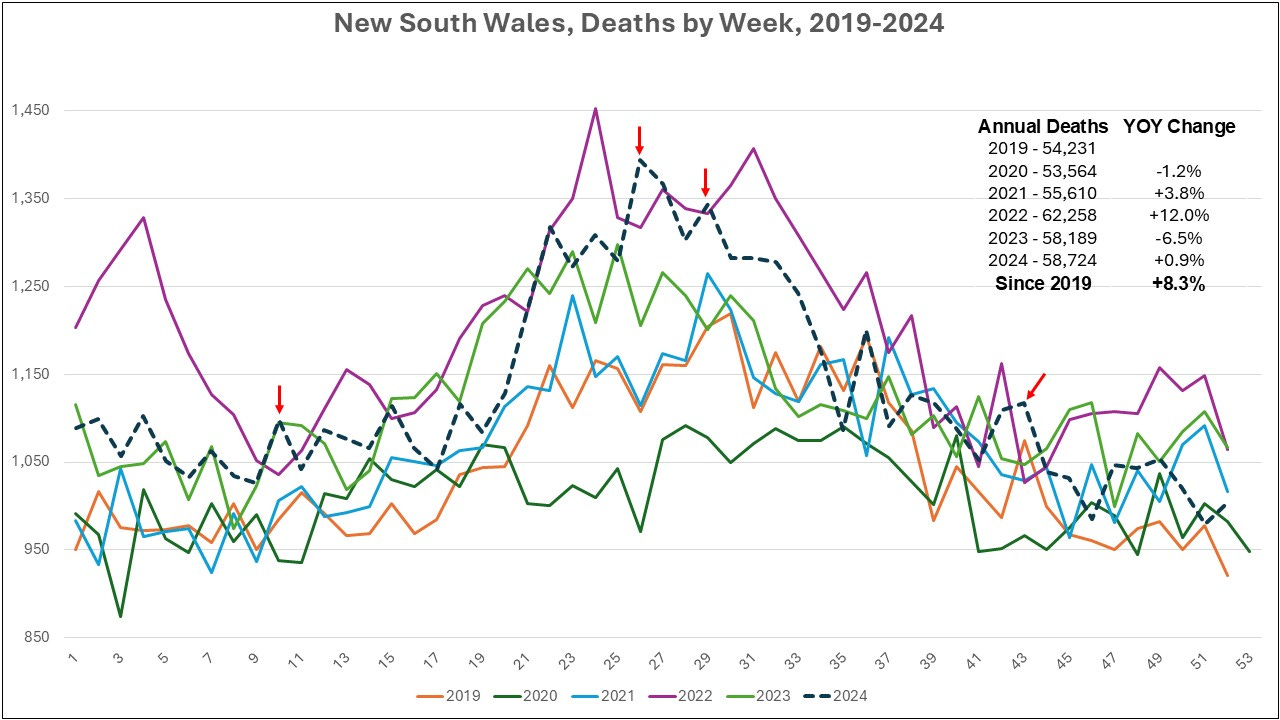
New South Wales, Australia’s most populous state with has about 32% of the population, has had an 8.3% increase in deaths since 2019. It had 4 weeks in 2024 where deaths exceeded all prior levels.
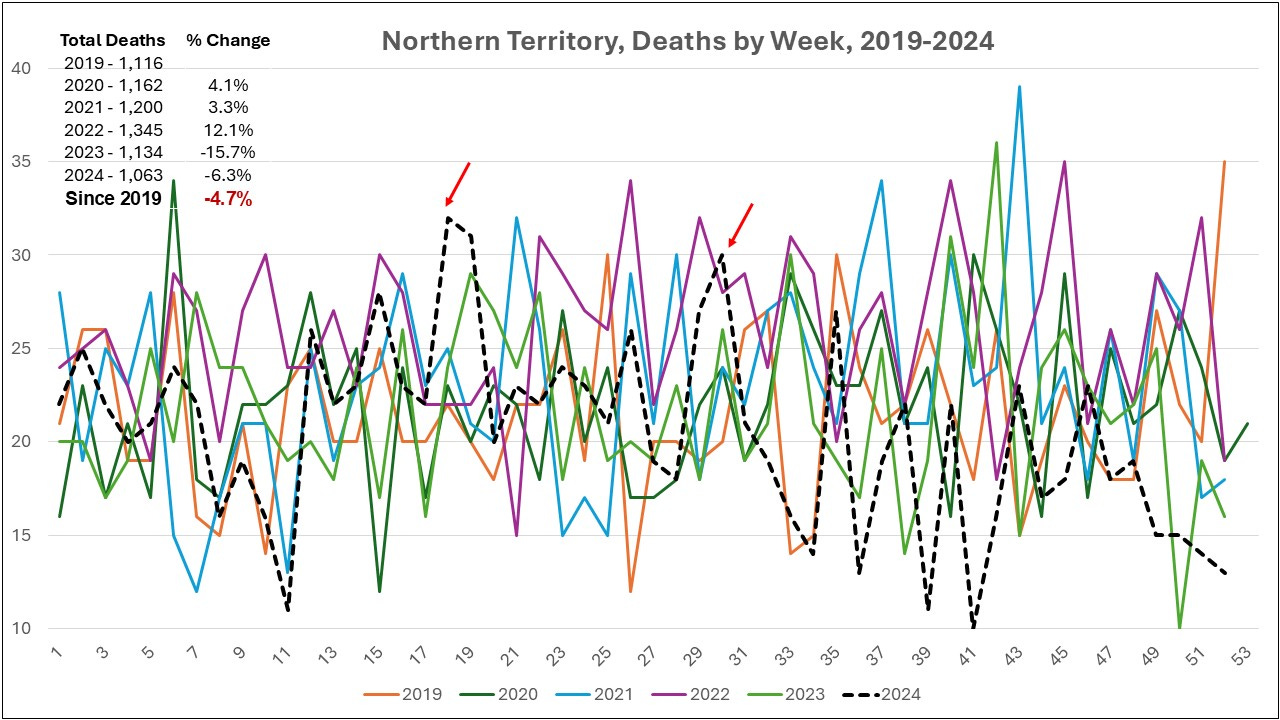
Northern Territory, Australia’s lowest population state, is the only state to have decreasing deaths since 2022, and to show overall decreasing deaths since 2019. It has only 2 weeks in 2024 with deaths exceeding prior levels.
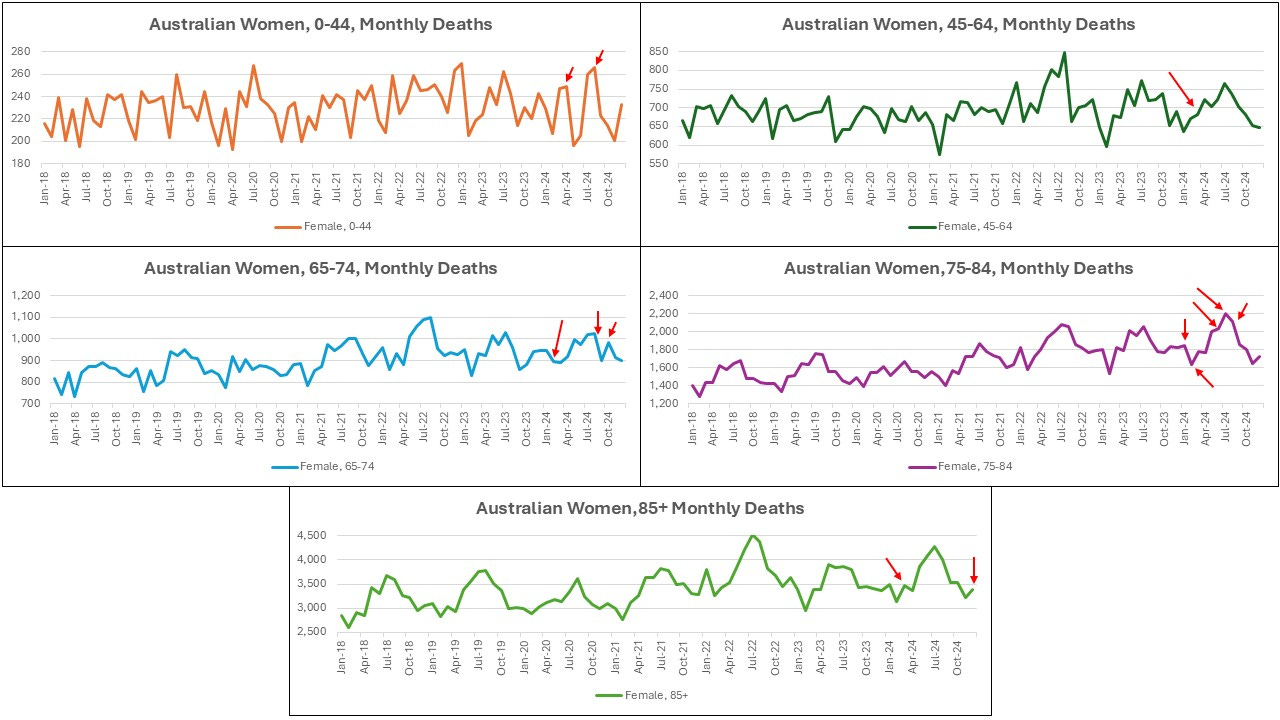
Deaths by Age
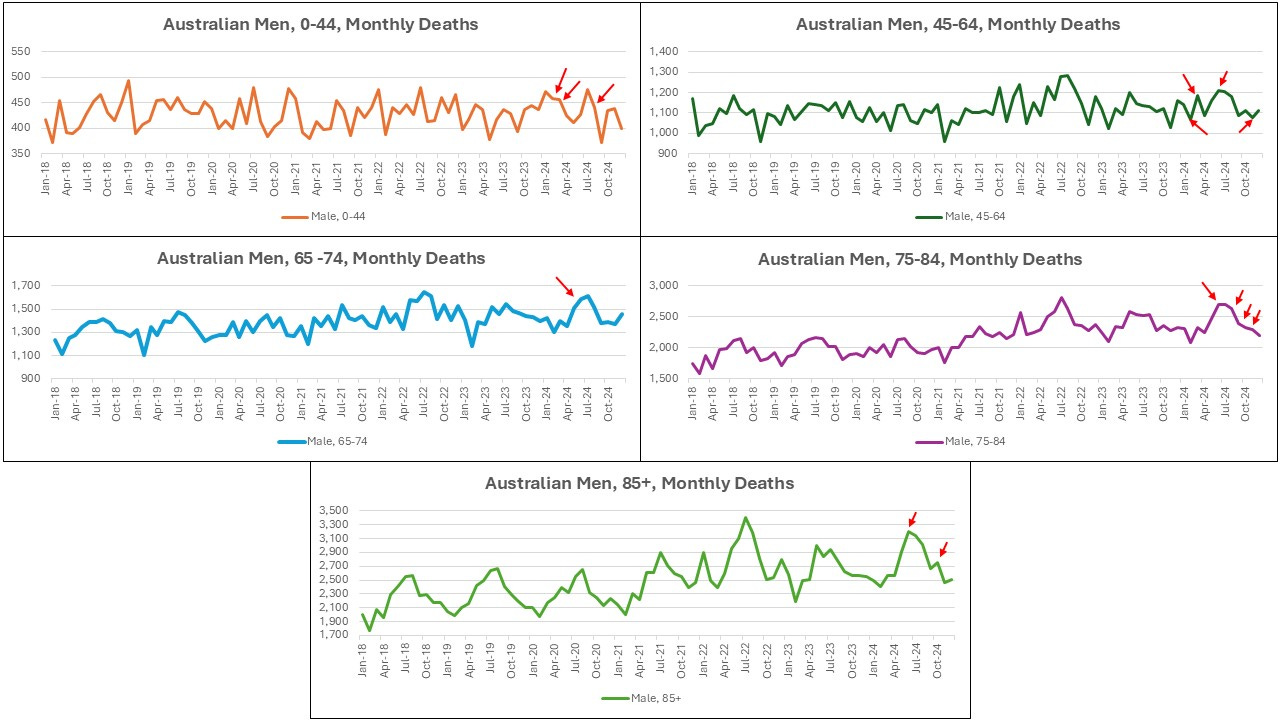
Males fare worse than females and older Australians are still dying at clearly elevated levels. Red arrows indicate the 2024 months that have deaths higher than prior historical levels.
Young (0-44) and middle aged (45-64), and elderly men (75-84) are showing clearly rising death patterns.
Elderly women, and particularly those aged 75-84, are showing escalating deaths. Premature deaths, meaning fewer Australians survive to late adulthood of 85+ could indicate worsening population health.
Could it also reflect the increasing adult vaccine schedule, where the government provides free vaccines to eligible adults under the National Immunization Program? Those aged 65 and older can avail free doses of covid-19 vaccines every 6-months, annual doses of influenza vaccines, and a 2-dose course of shingles vaccine. Those aged 70 and older can also avail of pneumococcal vaccines.
Australia is not a healthy nation. In 2024 1-in-6 people in Australia (18%) have disability “disability prevalence", and another 22% (more than 1 in 5) have long-term health conditions, but without disability! Only 60% are counted as healthy! Australia is critical need of its own MAHA! Make Australia Healthy Again!
My daughter Aurelia died of vaccine induced myocarditis in July 2024 - a tragic disgrace 😡
For reference.
Japan has received eight fake vaccinations (injected twice each time), and the all-cause mortality rate was the highest ever in history in 2024.
All Causes of Deaths [Canada]
2017 1340567
2018 1362470
2019 1381093 100% [28.5*1000 100%] ←Basic year
2020 1372755 99.4% [30.8 108%]
2021 1439856 104.2% [31.1 109%]
2022 1569050 113.6% [33.4 117%]
2023 1575936 114.1%
2024 Breaking News 1618684 117.2% ←Average life expectancy and life expectancy should also be lower, but the calculation will be made after the summer of 2025
Reference: Vaccination rate at the end of each dose
First time February 17, 2021 80.8% Stab twice each time, mostly BNT162b2, some Moderna
Second time in June 2021? 79.9%
Third time December 1, 2021 67.5%
4th May 25, 2022 45.6%
5th time August 1, 2022 27.2% 2022 end-of-year vaccination rate: about 20%, about 35% throughout the year (3-5 times)
6th May 8, 2023 17.5%
7th time: September 20th, 2023 - 13.9%
8th October 2024 - 10% (Reference value: Nagoya City's end of December) This is a replicon type that is infectious both inside and outside the body.