

Australian Bureau of Statistics Population Data Drop
Read the fine print!

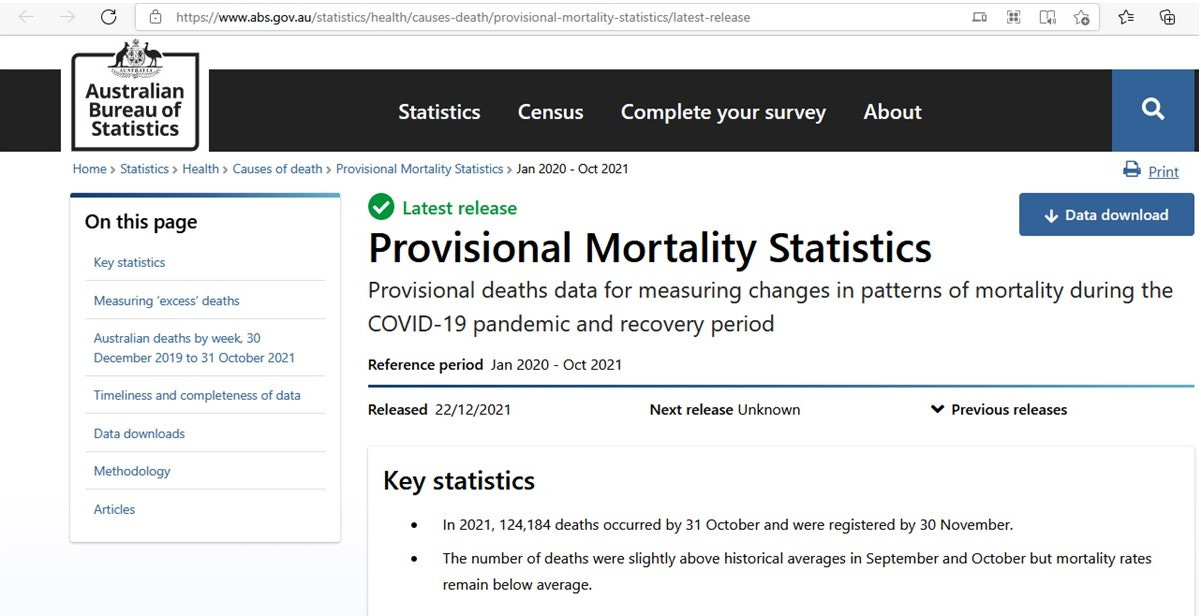
I have been waiting for the updated population data to be released in Australia. Finally the ABS has released data covering the period from January to October of 2021. Nothing too alarming to be seen from the overall images. They state that deaths were slightly above historical averages in September and October but mortality remained below average! Great! Nothing to see, move on!
…and here it is as a figure. Lines are a bit wonky, but nothing jumps out the way I have recently seen a jump in other countries.
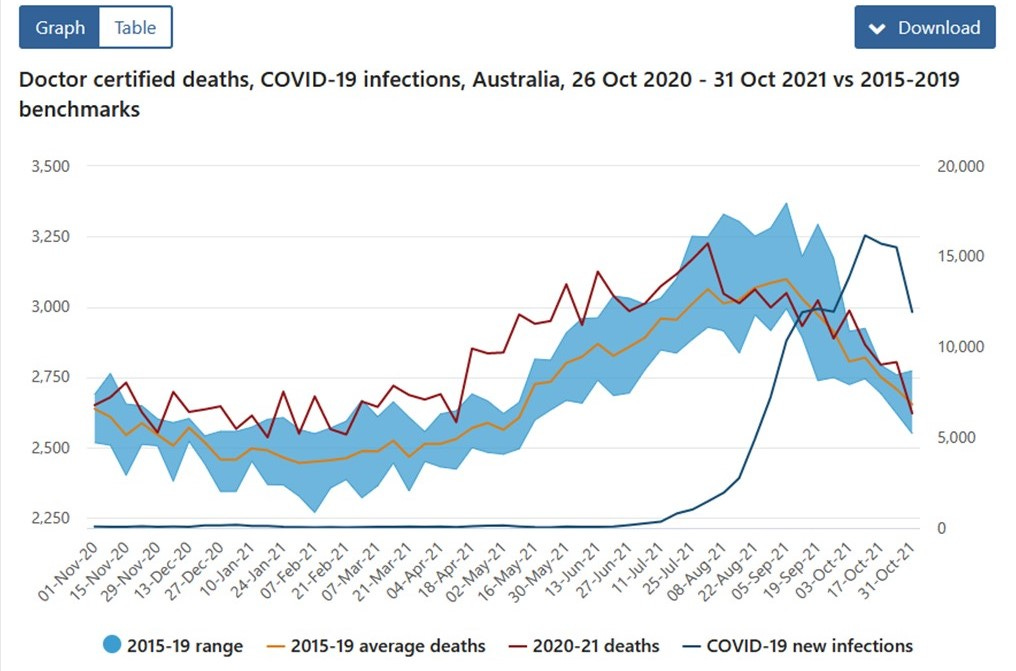
Is the data from January up to October 2020 Missing from this figure? Someone may need to do a deep dive! I don’t have time for that, yet!
Interesting title to the figure.. “doctor certified deaths”, what does that mean? I went to read the methodology… it turns out that these data are “preliminary”, as certified by a doctor, and they exclude any deaths where the coroner gets involved. Where does a coroner get involved? Any suicides, any suspicious deaths, any deaths where an autopsy is required….
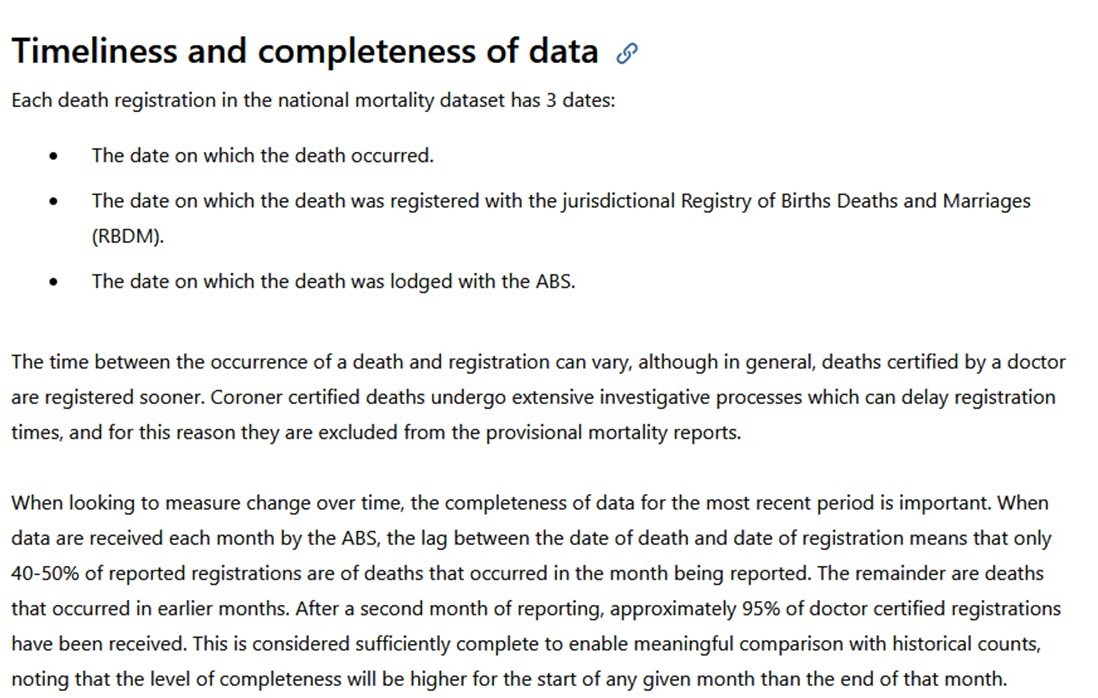
So this data it would appear does not tell us much of an accurate story at all. We are still waiting! We cannot make any conclusions at all.
The moral of the story is READ THE FINE PRINT!
Looking at the graph it seems that there is definitely missing data post 8th of August. Just looking at the pattern of the data makes this obvious, especially as there was nothing occurring at that time which would explain the 250 deaths drop that then continues until the end of the data set. Another question is 'historically, what proportion of total deaths are doctor certified?". This would give an indication of how many deaths are potentially not being counted.
What are the total deaths historically, including both Dr reported and Coroner reported deaths?
Many more questions than answers in the published graphs.