

Canada's Vital Statistics Over the Pandemic Years Show Major Changes in Death Patterns Particularly Matching 3rd and 4th Doses Administration. Birth Drops Become Pronounced in 2022 and 2023.
Young and working age adults showed biggest death changes in 2020 and onwards.

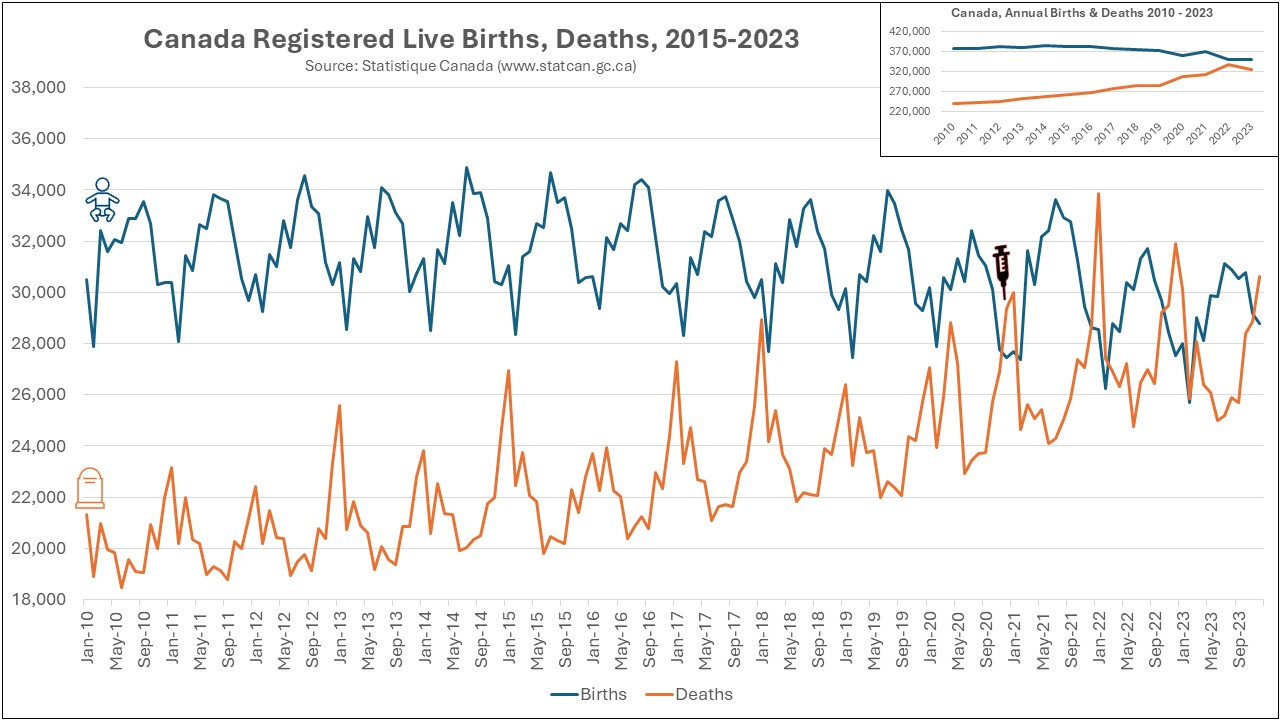
Vital statistics are absolute figures of births and deaths. In a healthy population they follow very consistent monthly and yearly patterns with only slow changes representing demographic changes. While they give no indication of cause of death, they are an excellent indication of health of the population. An illness that takes out vulnerable population earlier than they would have otherwise died is observed as a spike in deaths / excess deaths but is then followed by fewer deaths as there are no longer as many vulnerable people to die. External causes of death, say a mass accident, a war causing unexpected deaths… these events display an excess death peak, but are not followed by a drop in deaths. Pandemic year deaths look very much like external cause deaths, with no return to prior death rates.
Canada’s typical patterns births and deaths are fascinating; and very seasonal. Deaths are highest at the end of winter (January) while births are highest in August-September reflecting early winter conjugal activities. Canada’s highest ever birth year was 2009 (not shown), but this was followed by years of relatively stable births.
Higher peak death years are followed by lower peak death years, clearly demonstrating that vulnerable people die in some years (possibly bad flu seasons and/ or particularly harsh weather) but these years are followed by lower death years.
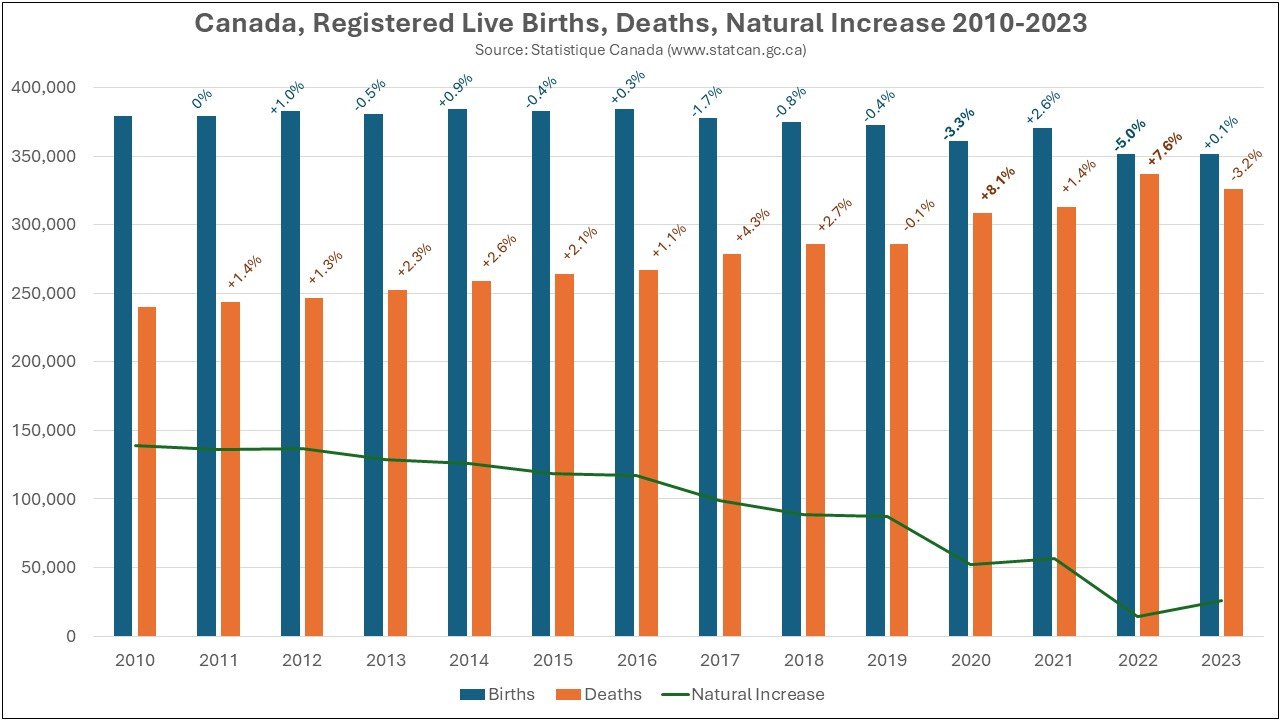
Unlike much of Asia and Australasia where there were no excess deaths in 2020, Canada did have excess deaths in 2020. Possibly due to hospital protocols and harsh lockdown related, as well as the seeding of illness into nursing homes. There was also a historically unprecedented large drop in births in 2020. Canada had its lowest natural population increase in 2022 of only 14,681 births exceeding deaths. 2024 data is not yet released. Trending since 2010 is shown with year on year % changes.
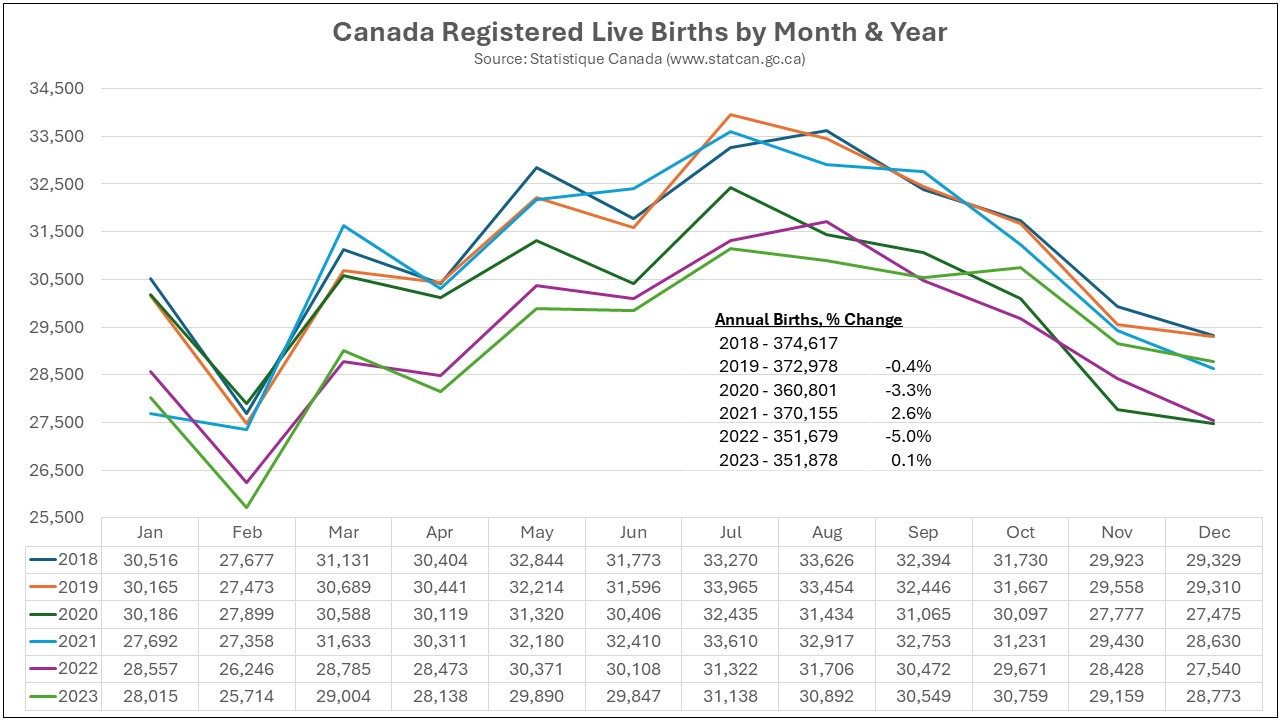
Birth and death data plotted by year and month with % change shown from 2018 to 2023. Births dropped sharply in 2020, recovered somewhat in 2021, but then dropped again in 2022 and did not recover in 2023.
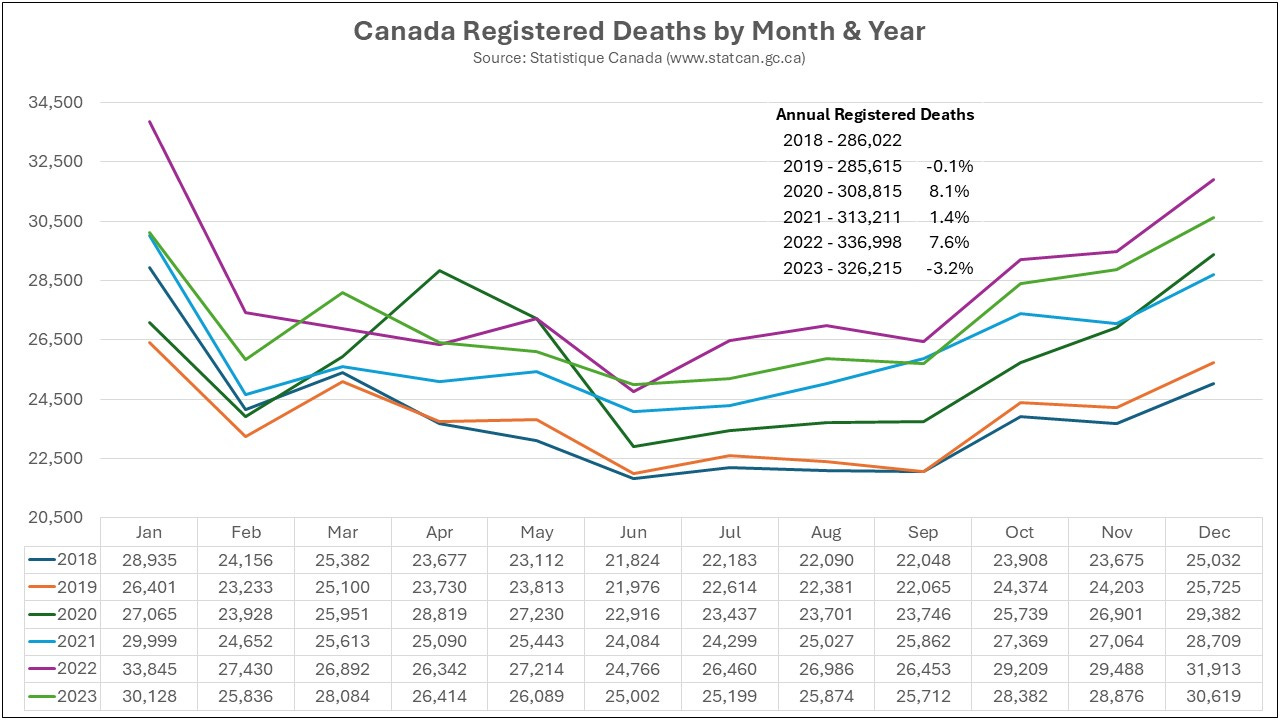
Deaths rose from April 2020 (lockdowns, hospital and nursing home protocols), and continued rising until 2022. Deaths dropped in 2023, but remain well above pre-pandemic levels.
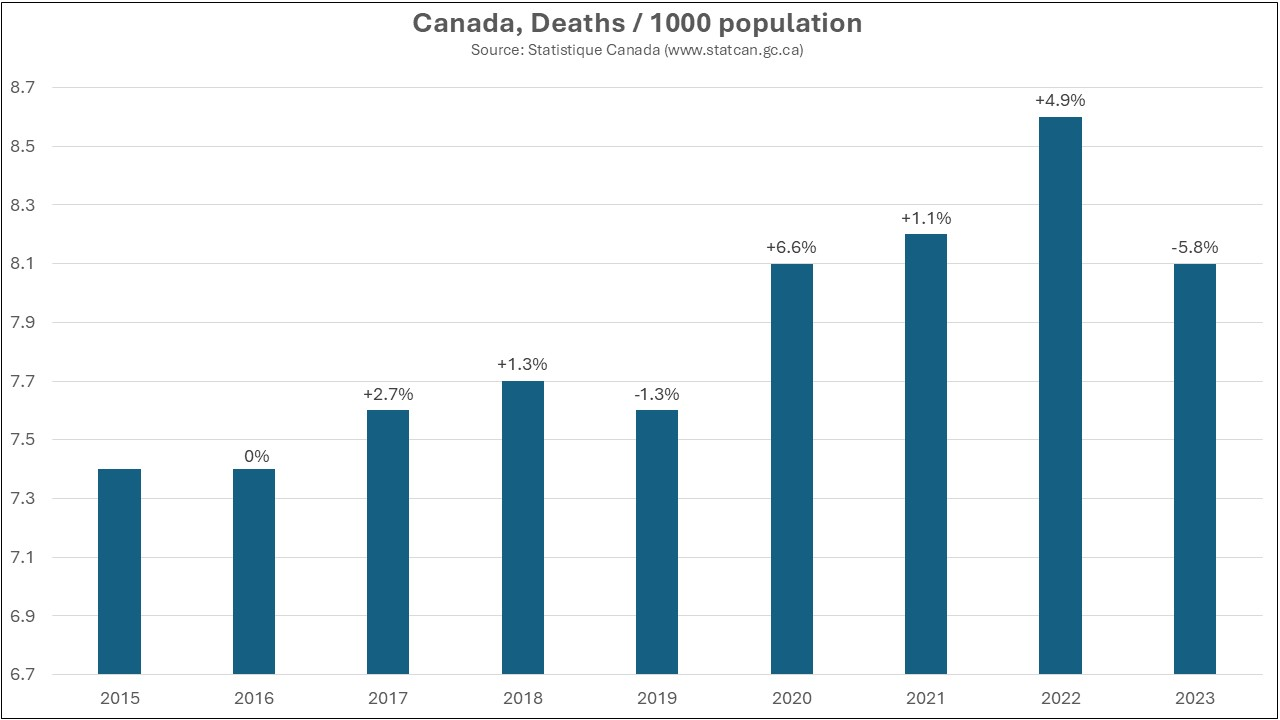
Could Canada’s migration have affected death rates? Annual deaths rates per 1000 population are plotted. This does reduce the % changes somewhat, however the patterns of deaths from 2020 onwards are atypical and remain well above pre-2020 levels.
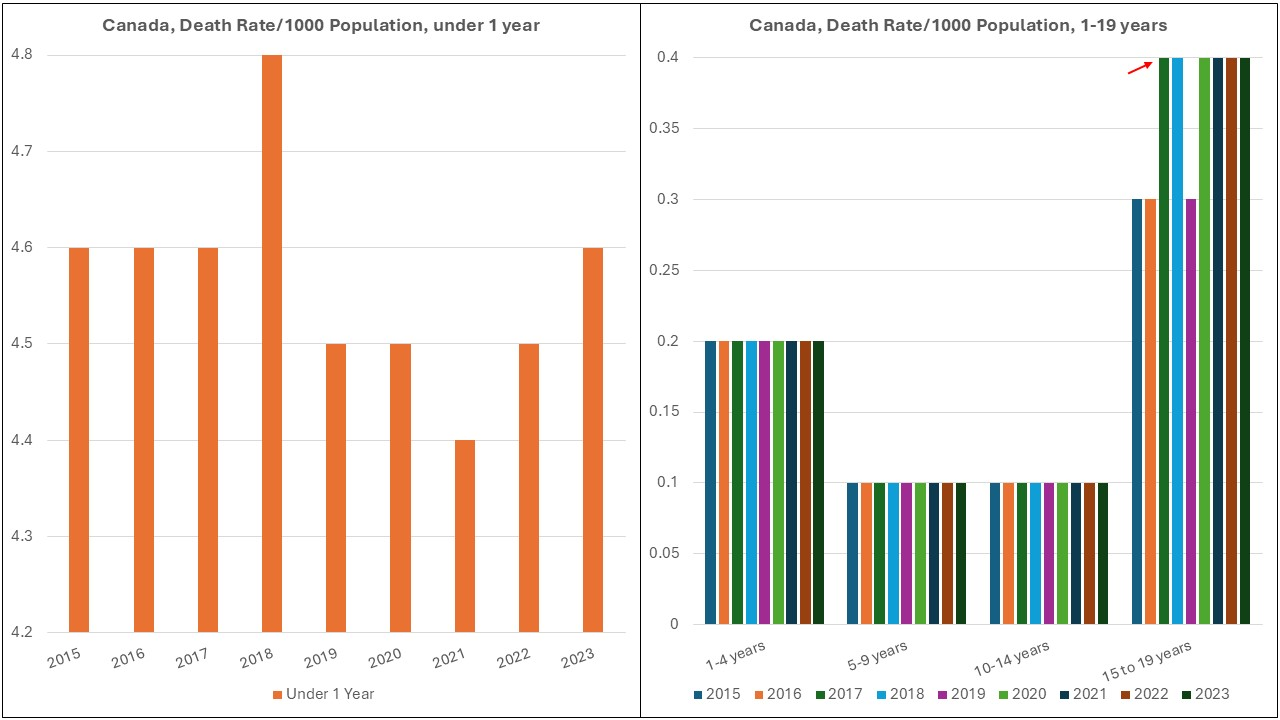
Deaths by age can also be examined. These are population standardized per 1000 population. Infants showed lower death rates over the pandemic years, rising back to typical levels in 2023. Children aged 1-14 showed stable deaths in this data, though the 15 to 19-year-old group first showed a death spike, which was then sustained except in 2019, from 2017.
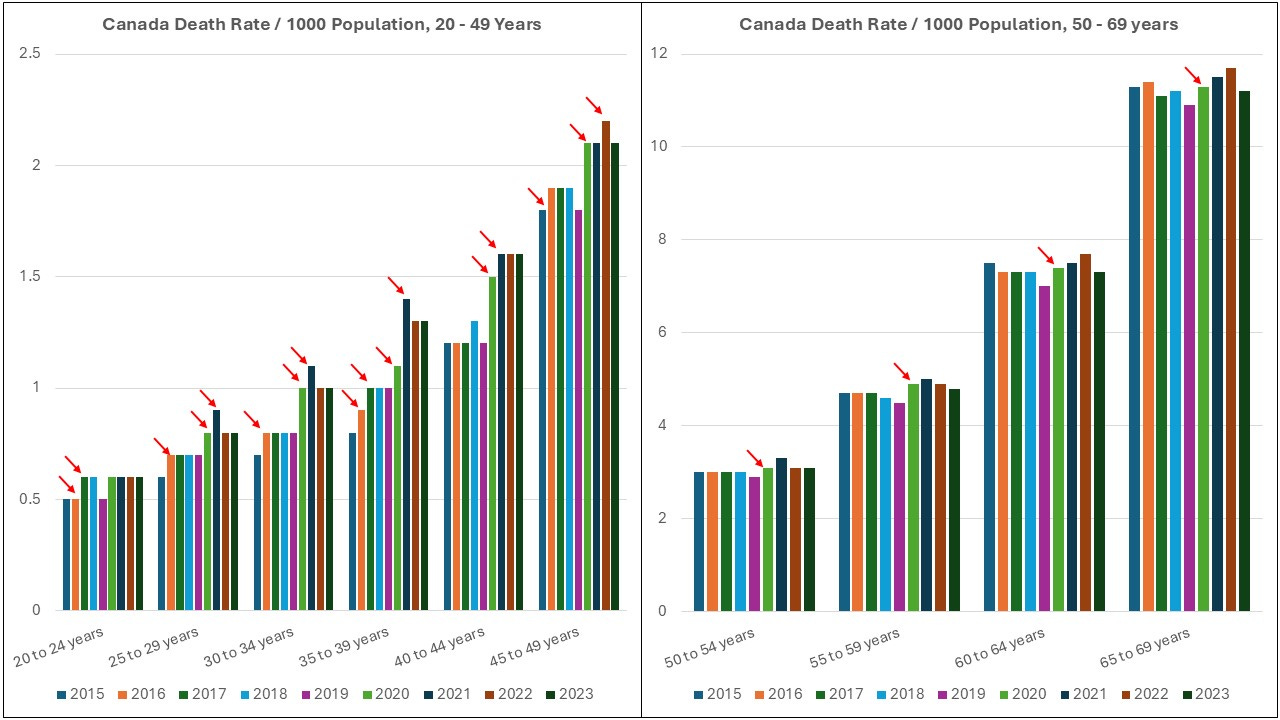
Deaths in young adults 20 to 49 are not stable over time and are increasing. Highly concerning that what should be the healthiest part of the population are showing rising deaths, even prior to the pandemic. Their deaths in 2020 are alarming! This was not the group literature identified as vulnerable to Covid-19 deaths, yet they were dying, with deaths rising further in 2021. 45-49 yo had their highest deaths in 2022.
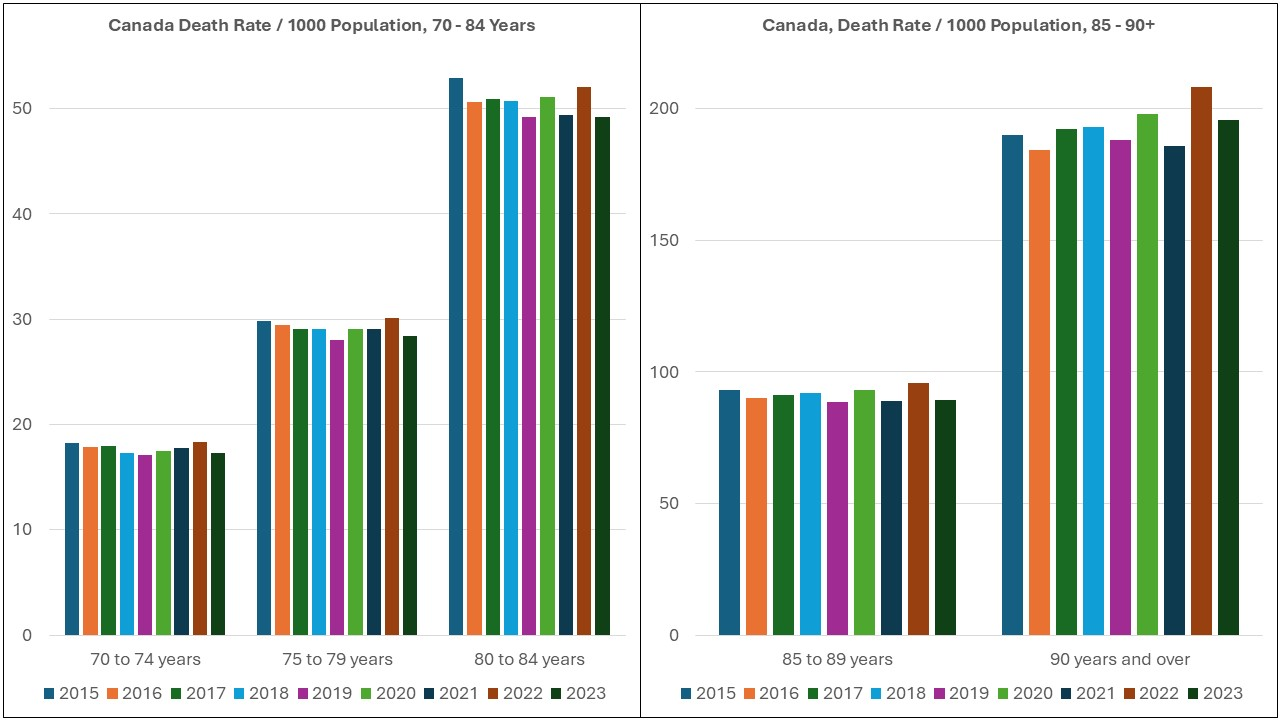
The seniors do not show remarkable data from the Canada statistics. This is quite different from the Australian data previously discussed where seniors died in mass excess.
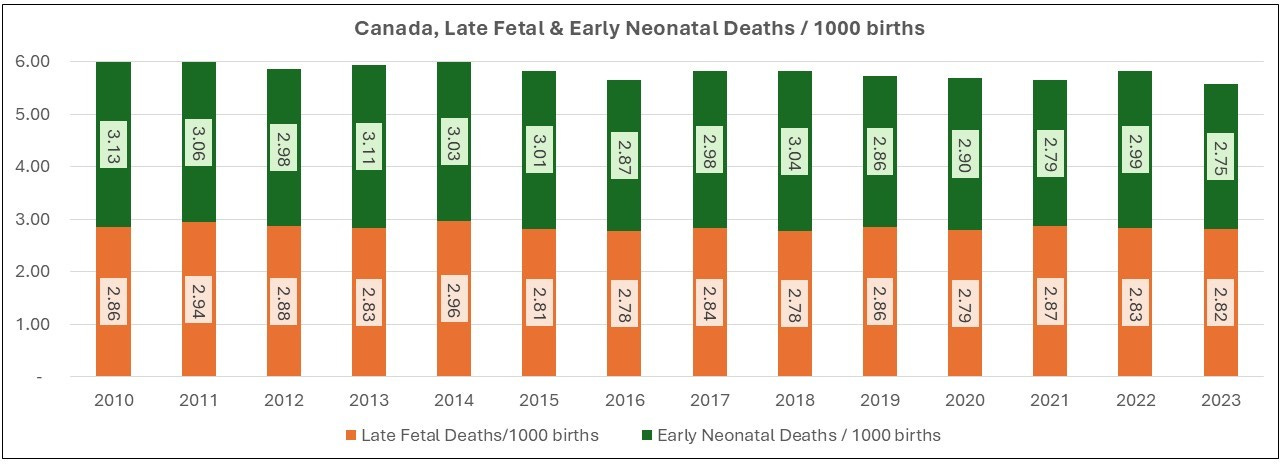
Infant and perinatal death rates do not show any outstanding trending from these data sets.
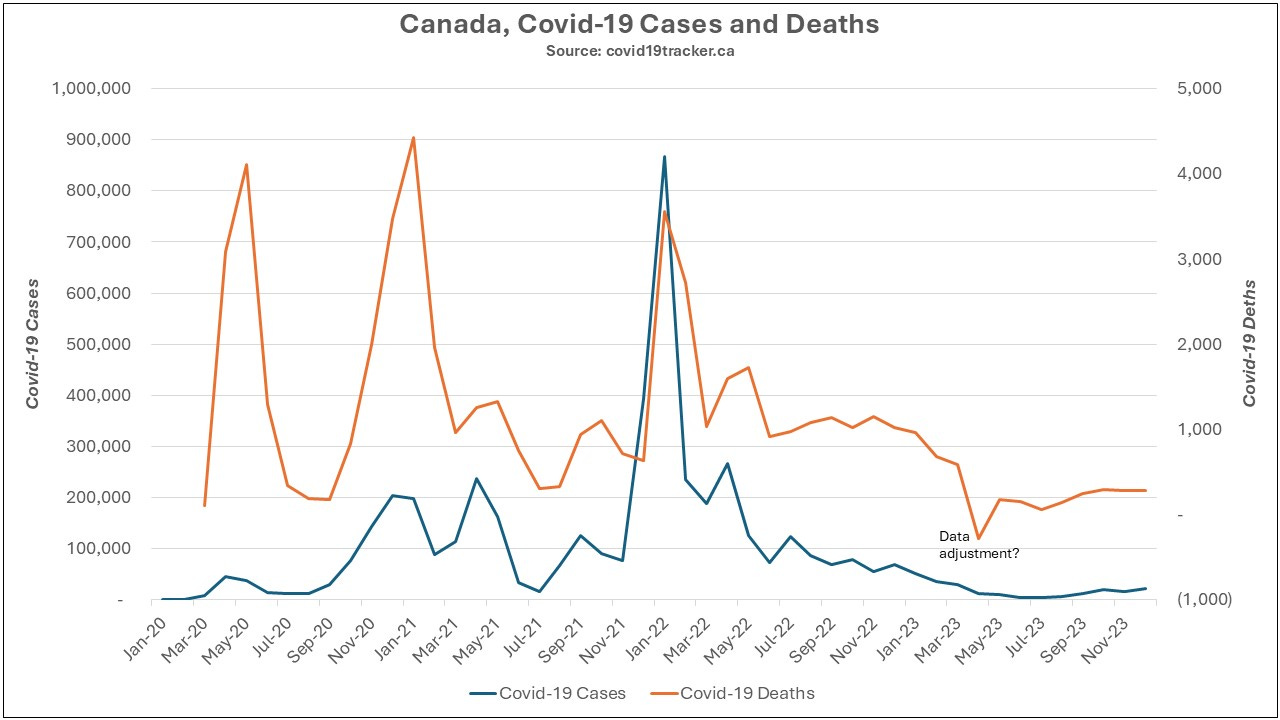
Covid-19 cases and deaths are plotted. Death rates were clearly highest in 2020. Cases showed an undulating pattern but spiked massively in January 2022, dropping off thereafter. The negative covid-19 death point in 2023 is likely a data adjustment by the vaccine tracker.
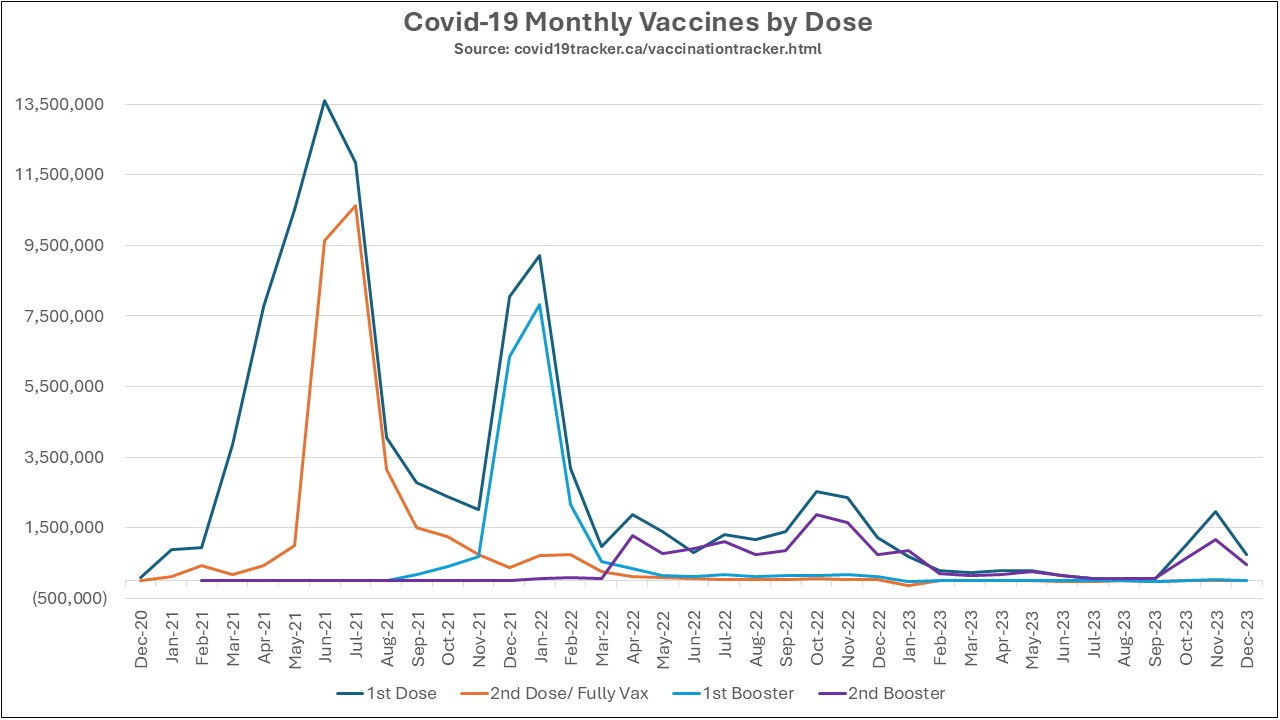
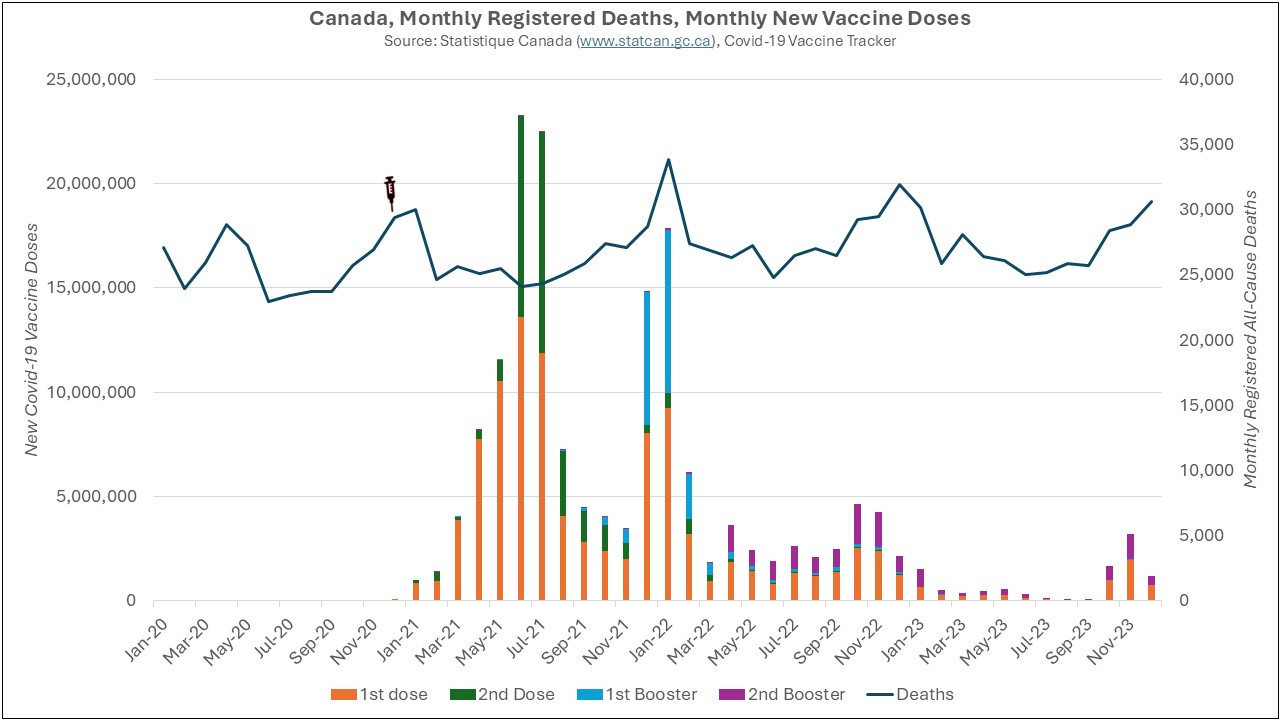
Covid-19 vaccines rolled out in December 2020. New vaccine administration, broken down by dose is plotted. Primary series dosing peak in September 2021, Booster dosing peaked in January 2022.
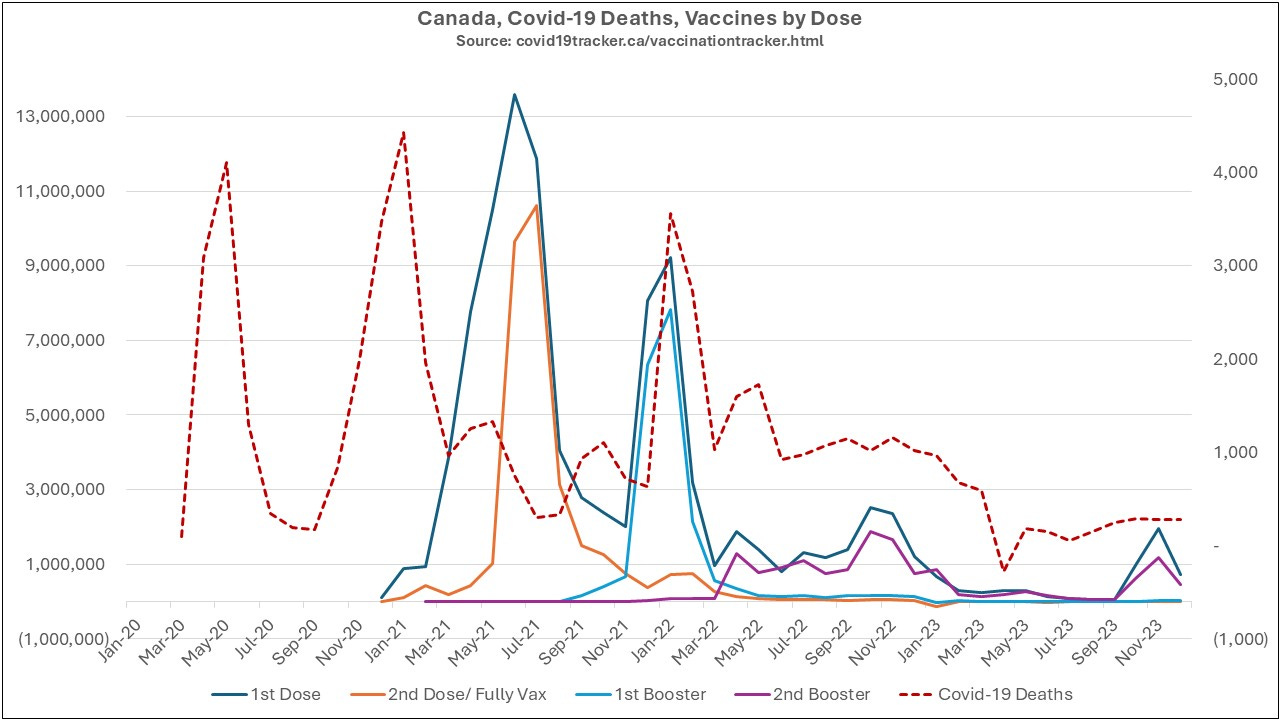
Vaccines plotted against Covid-19 deaths show that there was an apparent drop in Covid-19 deaths following primary series rollouts in 2021. It also shows that Covid-19 deaths spiked exactly concurrent with 1st booster rollouts in 2022.
I have seen this exact same pattern of all-cause mortality soaring with booster dosing in Hong Kong, Singapore, Macau and Australia. I am suspicious that these 2022 Covid-19 deaths were really vaccine deaths.
Plotting vaccine doses against all-cause mortality; the trending is clear. A spike in deaths in 2020 was unrelated to vaccines, likely including the deaths of vulnerable who could not withstand brutal lockdowns in response to the pandemic declaration or succumbed to hospital protocols failing to treat respiratory illness. Lower deaths followed in 2021; the most vulnerable had already died in 2020? However, deaths spiked in January 2022 and remained higher than all prior level deaths thereafter! Further, December 2022 was the first time ever that deaths peaked early in December, instead of in January. Was this related to the peak delivery of 4th doses (second boosters) in October and November 2022 with vaccine harmed and vulnerable people dying prematurely?
Anyone following vital statistics should have seen these outcomes developing in synchronicity with the EUA products being rolled out, should have taken action early.
That never happened! Anywhere! The intent was always to roll out these products regardless of outcomes or consequences. More ominously, this likely was the intended consequence!
Patterns of increasing deaths and plummeting births continue!
Thanks for the analysis. Do you think some of the aberrations may be due to Canada more actively fiddling with the data?
https://https://youtu.be/eDJxnG__4IU.be/eDJxnG__4IU