Philippines Case Study #3: Region II (Cagayan Valley) Comparison of Historical Death Rates, Excess Mortality in 2021, and Covid-19 Deaths
Deaths in 2020 were below forecast levels. Deaths in 2021 were 38.1% above normal forecast levels (range 22.3 - 43.6%) and occurred biphasically with peaks in April / May and then August to October.
Region II (Cagayan Valley) is an administrative region in Luzon Island with the five provinces of Batanes, Cagayan, Isabela, Neuva Vizcaya and Quirino. The longest river in the Philippines, the Cagayan river runs through the region and is a popular tourist destination. The region has a land area of 28,229 km2, and in 2020 had a population of 3.68 million.
Historical all-cause mortality from 2015 to 2019 was used to forecast the expected deaths in 2020 and 2021. These were then compared with actual registered deaths. All cause mortality death patterns by month were plotted, covid-19 deaths by day and year were also plotted. All of the source data used for this evaluation are publicly available and were downloaded from the Philippines Department of Health Covid-19 Tracker, and from the Philippines Statistics Office site and/or as released under FOI request.
Similar to other regions already assessed in the Philippines, historical death data was typically stable with only minor changes from year to year. Typical monthly death patterns were also stable. The end of year data for 2021 is still incomplete, and thus final excess deaths are likely to be (considerably) higher than those presented here.
Region II Cagayan Valley showed no overall excess deaths in 2020; deaths were well below forecast levels. However, in 2021 deaths soared and there were 8,902 excess deaths, 38.1% above normal. These deaths started in March of 2021, and showed two distinct peaks with the first being in April / May, and the second peak occurring from August through to October. End of year data is still incomplete and cannot be assessed.
A breakdown by province for each of the five provinces was conducted, using the same approach that was used for the overall deaths. The first province Batanes is the smallest. Given its small population of 18,831 in 2020, the relative year on year deaths rates are more variable. This is reflected in the forecast upper and lower bounds. Batanes had higher than forecast deaths in both 2020 and 2021, just above and just below the upper bounds. In 2021 two small peaks of excess deaths were apparent from May to June, and then in September. Batanes had no covid-19 deaths in 2020, and only 2 deaths in each of 2021 and 2022. Hardly a pandemic in that province!
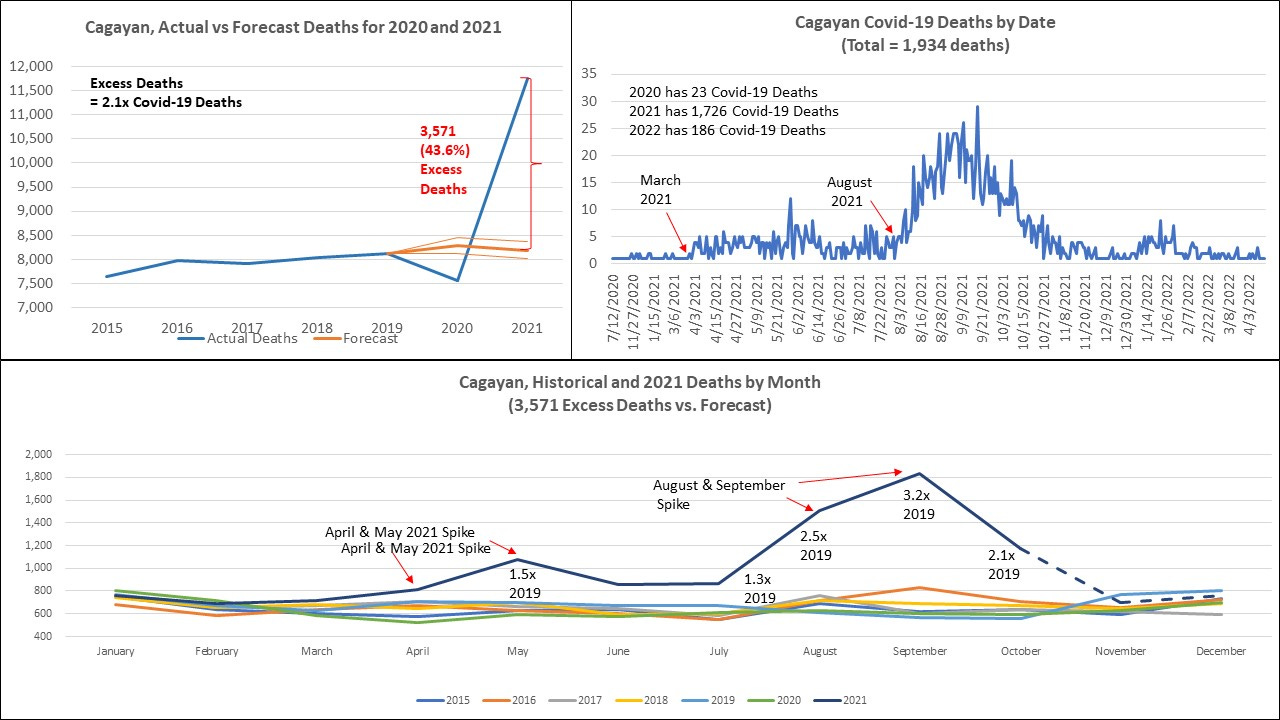
Cagayan Province had a population of about 1.27 million in 2020. Cagayan showed below expected deaths in 2020, but 3,571 excess deaths (43.6%) in 2021. There were biphasic death spikes in 2021, with the highest spike being 3.2x higher than 2019 levels in September 2021. Excess deaths in 2021 were 2.1x higher than covid-19 deaths, thus covid-19 infection does not explain these excesses.
Isabela had an estimated population of 1.7 million in 2020. It also had well below expected deaths in 2020, and also only 37 covid-19 attributed deaths. In 2021 it followed the typical biphasic spike of excess deaths with the first peak at 1.6 and 1.7x 2019 levels in April and May, and the highest spike of deaths in September at 2.5x the 2019 death rates. Total excess deaths were 3,854 or 35.1% above expected levels. Covid-19 attributed deaths were 2.3x lower than the excess deaths.
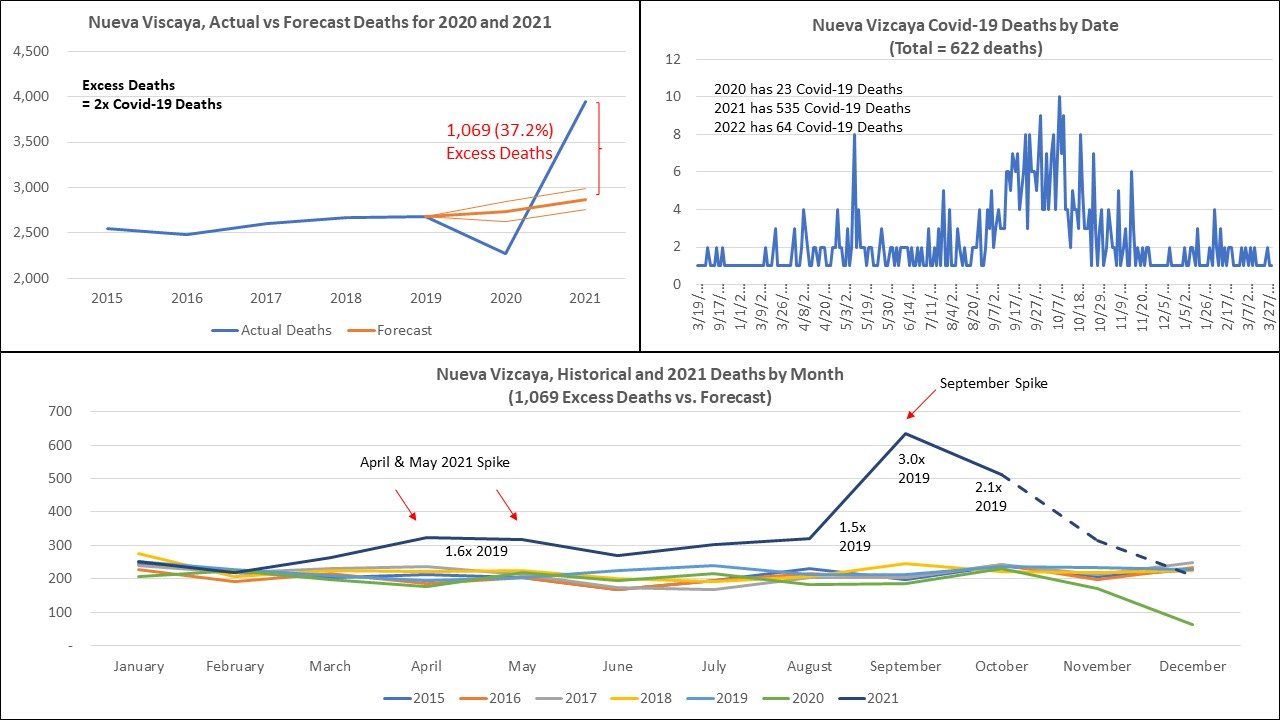
Neuva Vizcaya (population 497,432 in 2020), after below expected deaths in 2020, had 1,069 excess deaths (37.2%) more than forecast in 2021. This province had a small primary peak in April and May and a large peak at 3x 2019 levels in September. Covid-19 attributed deaths were 2x lower than the excess deaths.
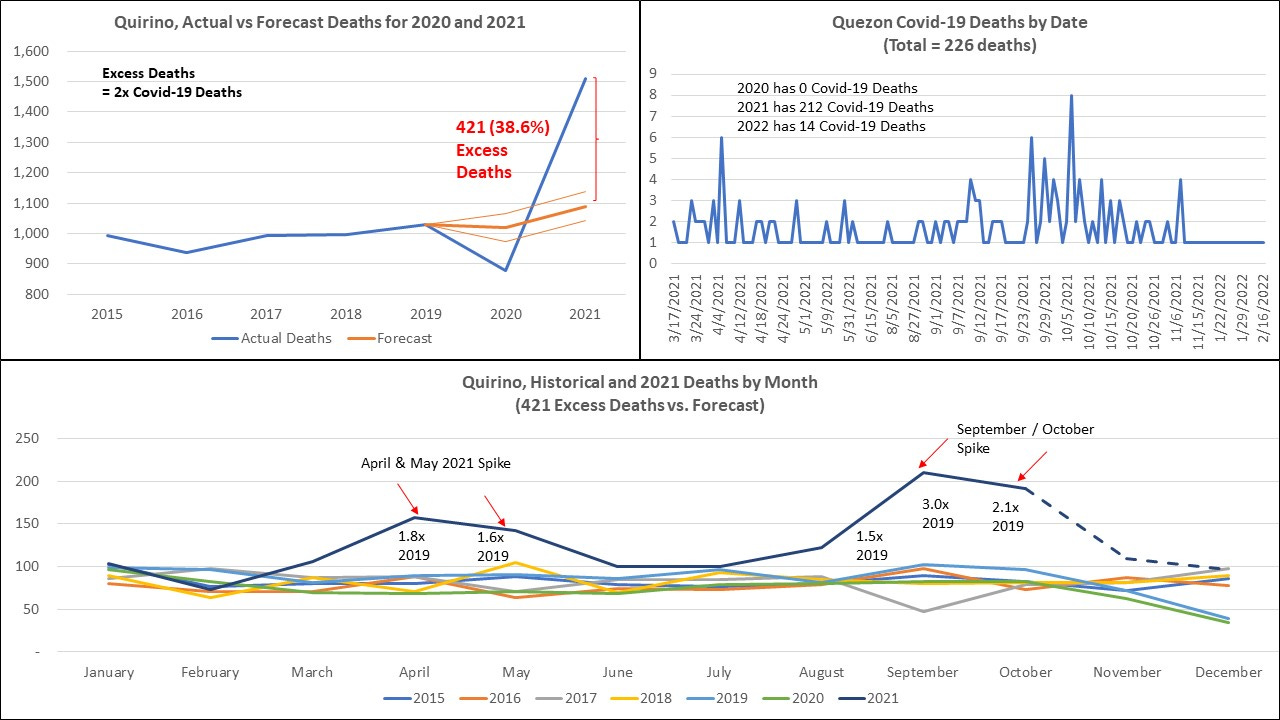
Finally Quirino (population 203,828 in 2020), also showed the same pattern as the other provinces with 421 excess deaths (38.6%) above expected 2021 level. They had no covid-19 deaths in 2020, 212 deaths in 2021, and only 14 deaths in 2022. Covid-19 attributed deaths were 2x lower than the excess deaths.
The biphasic death spikes in all locations matched the biphasic roll out of covid-19 vaccines, first to health care workers, the elderly, and vulnerable persons starting in March 2021, and then to the entire population by 3rd quarter of 2021. The role of the covid-19 vaccination in the excess deaths needs to be determined.
There were no overall excess deaths in 2020. It could not be expected that the lockdowns that were consistent and ongoing throughout 2020 and 2021 could have caused sudden biphasic spikes in deaths. These had to be due to other external forces.
In the case of provinces with small populations, Covid-19 vaccination was typically able to be rolled out quickly. If excess deaths were related to the vaccination, the spikes should be readily linked to the timing of the vaccines. Further research is still required to identify timing of vaccine rollout by individual province / city. This information is not readily available.
The biphasic nature of the death spikes seen in each province, varying in start month, and with deaths far above all historical levels likely indicate an ongoing and escalating causative factor. The scale of the excess deaths are also unprecedented within the available historical data.
The covid-19 vaccines must be considered prime suspects unless and until cleared by thorough investigation.


