Philippines Further Evaluation of Birth and Death Data
NCR 1st and 2nd Districts, 2020 and 2021 Data. Unnatural Death and Birth Patterns! High Excess Deaths. Dropping Births.
To further evaluate excess deaths and decreases in births, I needed to progress from evaluation of country wide data to regional data. This will show clearer patterns with less averaging effects. You can see initial review of country data on my previous recent articles.
For this evaluation I have simply compared 2020 and 2021 data, because I have it readily on hand, and there is an extreme urgency to get this data out.
All data presented for this article is for the Philippines National Capital Region (NCR). The First District is the City of Manila. The Second District encompasses the five cities of Mandaluyong, Marikina, Quezon City, Pasig, and San Juan.
I present that this data clearly shows sudden changes in and non-natural death and birth patterns. I would challenge that any person seeing this data can no longer say they do not know what is happening! You are put on notice!
All data is sourced from the PSA official population data drop posted on their website last 6th January. Please bear in mind the following points:-
Lockdowns in Philippines started on 16th March 2020, and have continued in various forms to date.
Normal daily registered live births in 2019 was 4,584. This reduced to 4,177 a day in 2020; an overall birthrate drop of about 10%. Thus the birthrate drops shown in 2021 represents even further drops from typical pre-pandemic rates.
Normal daily registered deaths in 2019 were 1,700. This reduced to 1,682 in 2019, a drop of about 1.1%. I.e. there were no excess deaths in 2020, even during the first year of lockdowns. There was also minimal difference from the 2020 data to the data in January and February of 2021. Thus increases in deaths in 2021, and particularly the sudden increases observed starting in March, cannot be attributed to the lockdowns. They must be attributed to the intervention that also started in March of 2021.
PSA death and birth data for 2021 are still preliminary. Additional births and deaths, particularly in the later months of the data set are still expected. This will make the EXCESS DEATHS shown in the figures below WORSE.
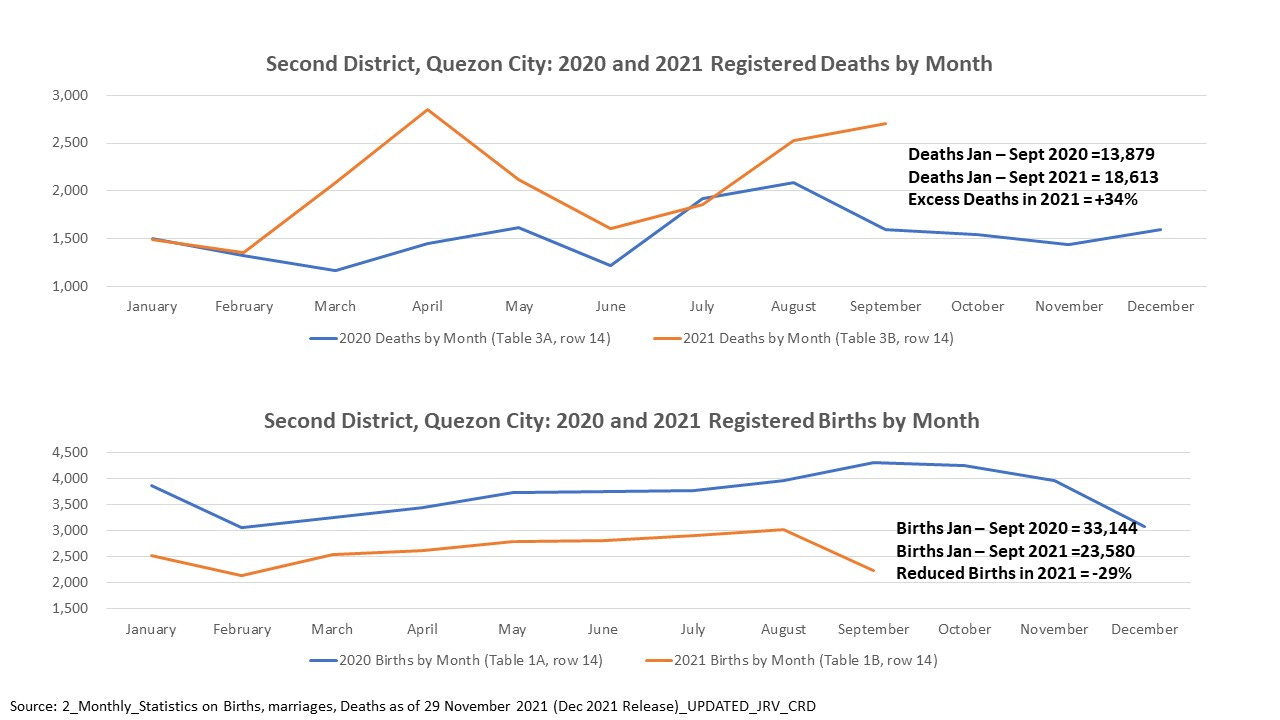
Excess registered deaths from 2020 to 2021 in the cities evaluated here ranged from 112 to 135%.
Reduction in registered births in 2021 compared to 2020 in the cities evaluated here ranged from 20% to 34%.
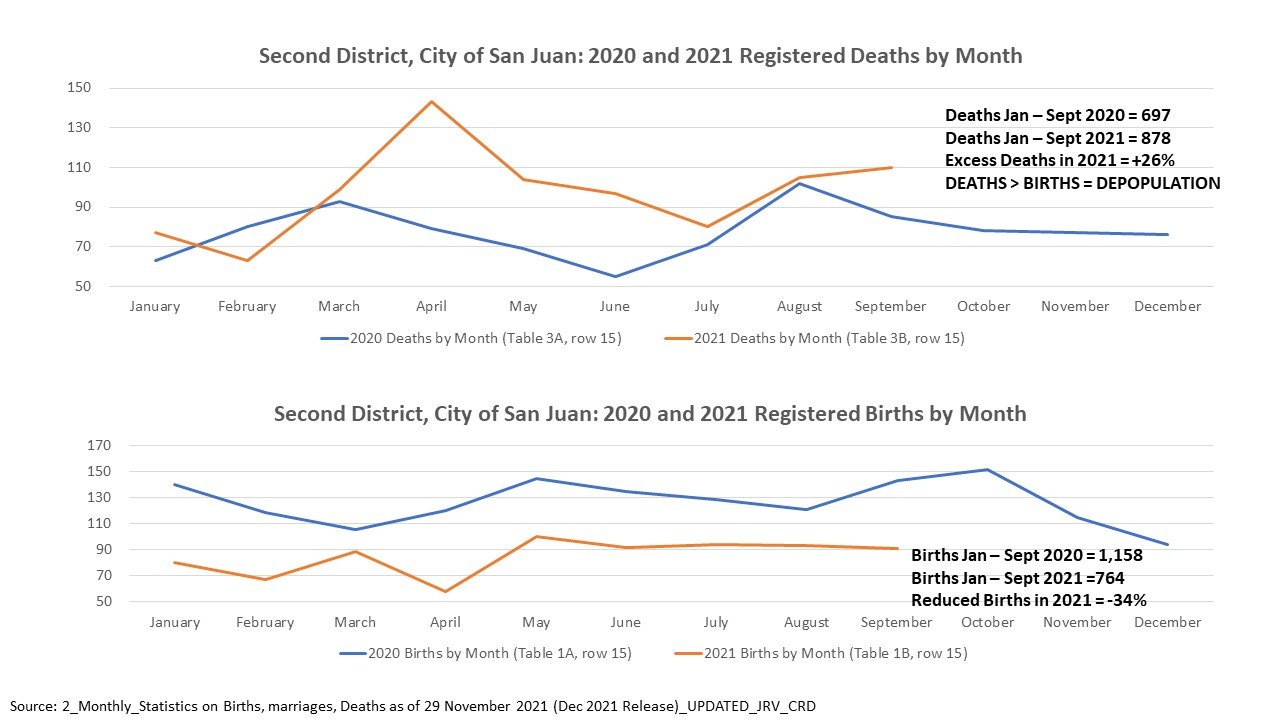
San Juan City showed depopulation in 2021 up to September with more deaths than births registered.
2021 data is only presented up to September 2021, which is the last relatively complete monthly data set available at time of this publication.
Second District Overall
Second Districts by City
San Juan shows overall depopulation. More deaths than births from January to September 2021.


