President Marcos is Pushing Booster Shots on the Population. Do His Graphs Support This Push?
Demonstrates the need to look closely at data, rather than simply accepting pretty lines and graphs at face value!
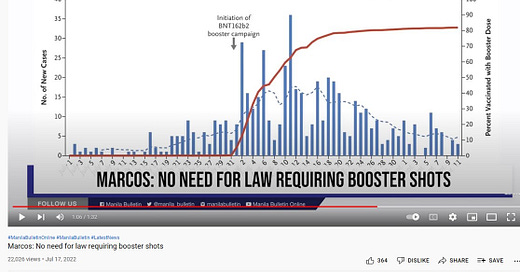
Here is the image behind President BBM during yesterday’s spiel to encourage booster uptake. This image was presented on the President’s U-tube channel in support of encouraging the booster shots: meant to show that booster shots (red line in %) prevent covid-19 new cases (blue lines).
Does it show what is being presented? Does it support the use of booster shots? I will break this down to show that there may be a different perspective!
The time scale of this data is over a 72 day period. The first 31 days shows PCR confirmed cases prior to booster dosing using the Pfizer Product. Then there is a period of 41 days post initiation of rollout.
From other sources we know that during the first 2 weeks post vaccination, the recipients immune system is suppressed and they are more likely to have covid-19 (and other) infections. We also know that for booster doses of Pfizer there is indeed a suppression of cases. However, the duration of suppression of cases, after the first 2 weeks of increased cases when the recipient is still not considered “vaccinated”, is only weeks to a few months. Here is the latest Walgreens Index, positivity by vaccine status. 2 or 3 doses less than 5 months ago show lower positivity than not vaccinated. All other time vaccine status and time periods are worse than being not vaccinated at all.
The time frame being presented, with only 41 day, post rollout shown, is not long enough to show outcomes. Further it is certainly not long enough to show the negative efficacy that is expected within a few more weeks! The data shown is incomplete!
The % of boosters being presented is high at over 80%. Note in this case the population went from no boosters to more than 50% in 1 week, more than 70% in 2 weeks and over 80% uptake by the 3rd week. I.e. very rapid delivery of boosters. This must be a small discrete study population. This is not the Philippines. In the Philippines current booster uptake is about 14% for first booster and < 1% for second booster.
The overall case rate shown in this graph before boosters started was lower than the overall case rate after booster rollout (5). However, again, the duration of the data presented is too short to show final outcomes. Literature amply shows that 2nd booster performs far worse than Not Vaccinated within 5 months (if not before).
Cases increased in the 2 to 3 weeks immediately following the rapid booster rollout. As discussed in point 1, it is known that the vaccines increase susceptibility to Covid-19 immediately following receipt. This is demonstrated perfectly by this graph.
I present that this data does not show what the President was implying that it shows! The take-away message? Do not accept data at face value without further detailed evaluation.


But it also shows the president has no idea what he is talking about and simply presents something like a script. "I only did so well, because I am fully vaccinated and boostered." Sounds also very familar.
Whoever gave or made this info to BBM must be a total moron or a Big Pharma “gift-recipient.” The usual DOH/IATF lackeys?