

Updated ABS Data: Full Data Sets for Jan-Feb 2025 were released on 3rd June 2025. Death Counts are at Their Lowest Post-Pandemic Level, though still well above Pre-Covid-19 Vaccine Rollout Levels.
This report includes an update on Covid-19 Vaccination uptakes, Births to September 2024, Rising Infant Mortality, and Population Age Distribution and Recent Growth.

ABS uploaded their usual data sets for 2025 mortality on 3rd June 2025, after my last update made on 30th May 2025 at which time they had only uploaded a summary mortality report for the first 2 months of 2025. I have prepared my typical breakdown data for easy reference.

ABS only report last 2 years data, ie. 2023 and 2024. Thus, it is necessary to generate historical comparison data for visualization from the historical data cubes provided by ABS.
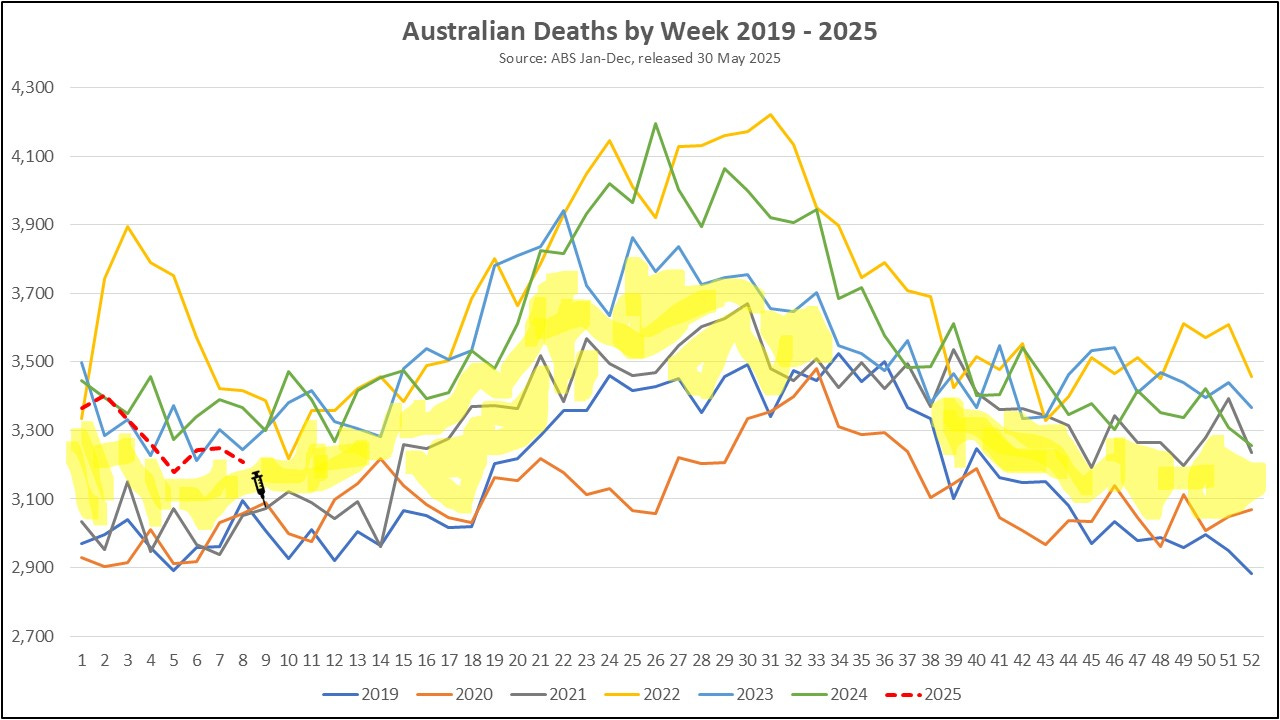
Weekly mortality since 2019 with yellow shading highlighting the separation in death counts that occurred post-rollout of the jabs that started on 21 February 2021. 2025 mortality is at the bottom of the post-pandemic death count range but still well above pre-vaccine rollout levels.
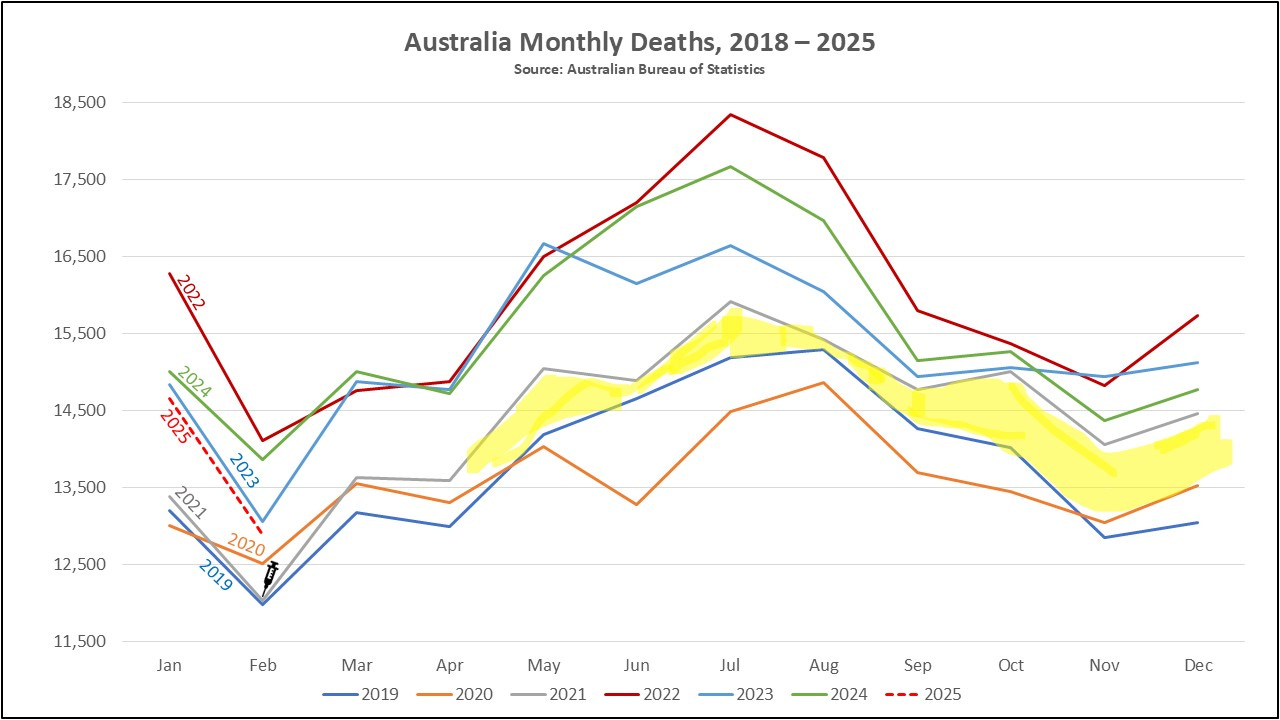
Monthly mortality since 2019, again shaded to show the separation in deaths that occurred from February 2021. 2025 provisional deaths are just slightly lower than 2023 levels. They may end up slightly higher than 2023 levels, but probably still lower than 2024 levels, once late registrations are added.
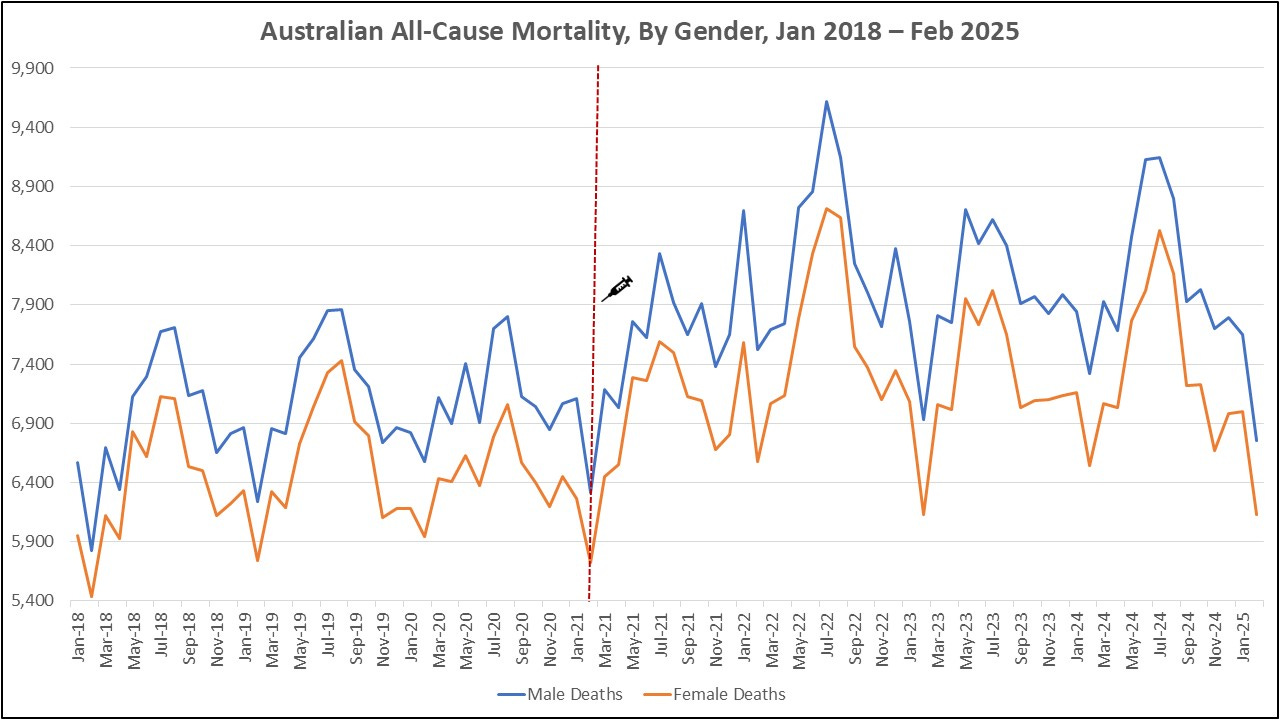
Males tend to die earlier and in smaller numbers than females.
Note the strong seasonality of deaths as evidenced in 2018 through to 2020. Australian peak deaths typically occur at the end of winter (July-August), and lowest deaths at the end of summer (February). This changed after the rollout of Covid-19 jabs. Not only was there a up step-change in death counts, there were also highly atypical peaks in deaths in January and December 2022, and a pre-winter death spike in May 2023. 2024 deaths returned to typical patterns but remain far higher than pre-pandemic levels.
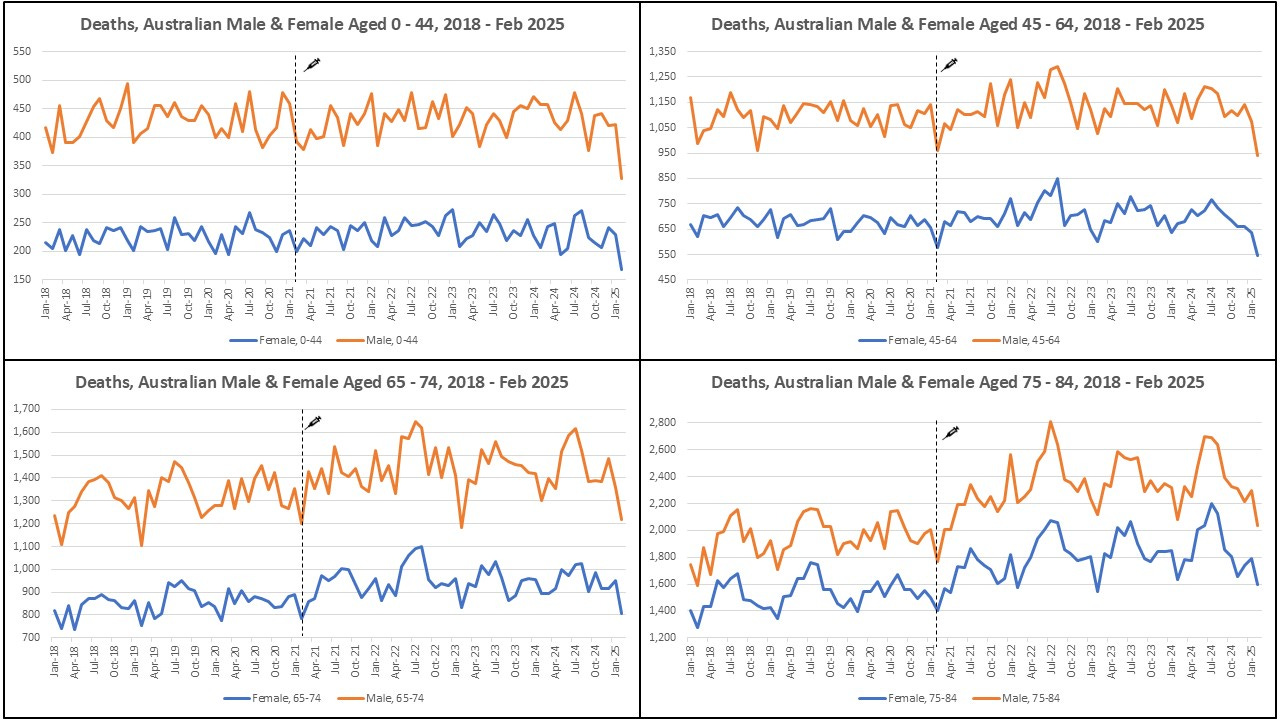
Many females survive to late old age before death. Deaths among women up to 84 years of age are much lower than deaths among the same age men.
Only among persons aged 85 and above do female deaths far outpace male deaths.
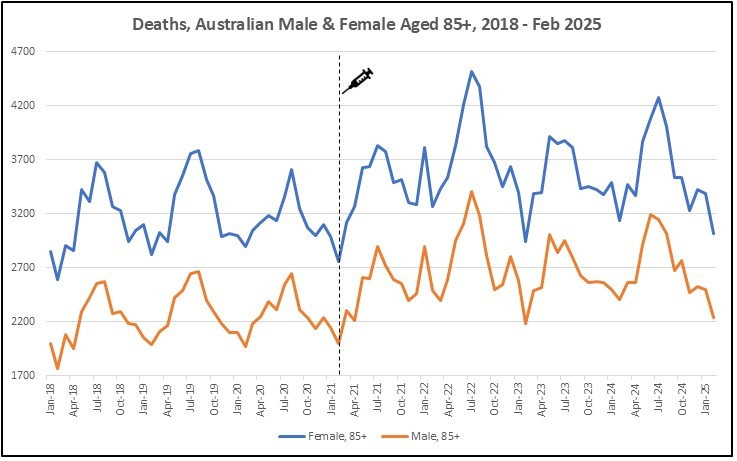
For the very elderly 85+, note that there were fewer than usual deaths in 2020: lockdowns were likely protective. Deaths rose in 2021 with a slightly higher mid-year peak. It could be argued this was a pull-forward effect compensating for the lower deaths of the previous year. Perhaps initial Covid-19 vaccines provided some protection with primary series. However, 2022 death patterns were highly unusual with death peaks in January and December as well as a massive winter death spike; booster doses were rolled out from late 2021 and into 2022 and could be causal for some of these deaths. 2023 deaths were lower; perhaps fewer senior left to die but rose again in 2024. 2025 January and February 2025 deaths are among the lowest since the start of vaccine rollouts.
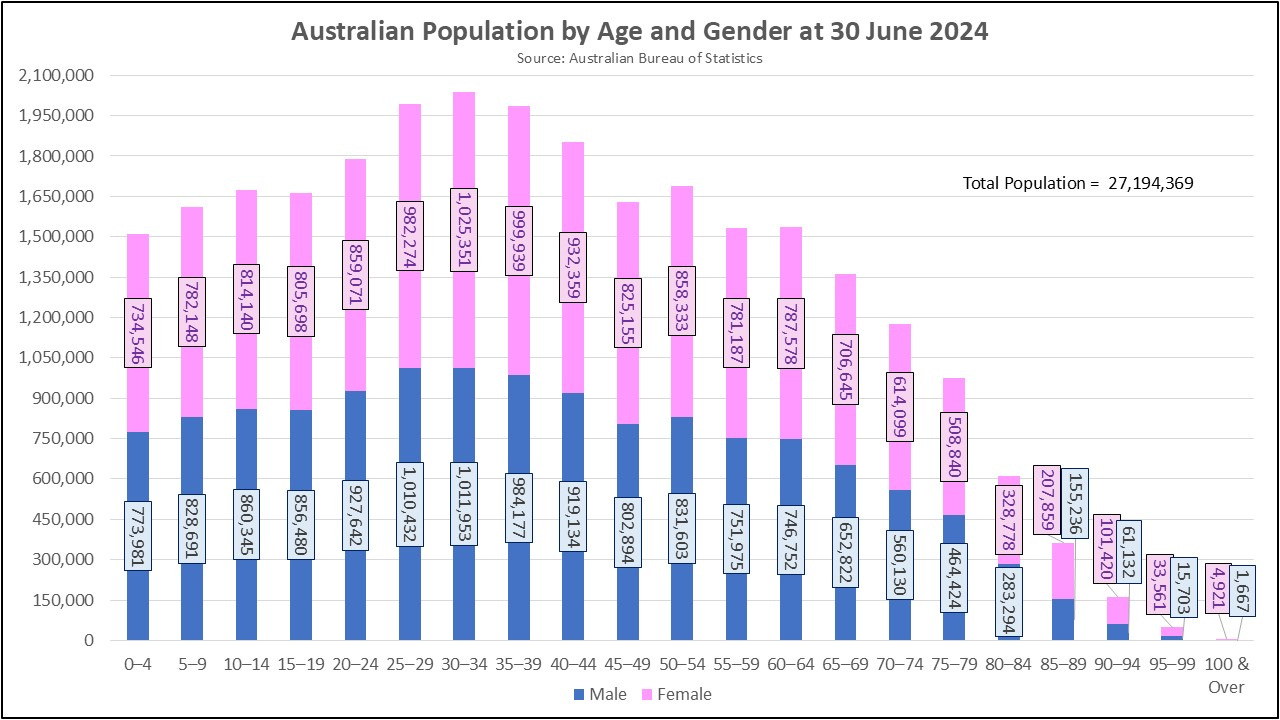
Population Distribution
For reference, 49.6% of the Australian population are male and 50.4% are female. Up to age 29, males outnumber females. Thereafter, due to earlier male deaths, females progressively outnumber males with the 100+ age group comprising 25% males and 75% females.
Update on Australian Covid-19 Vaccinations
Latest available Covid-19 Vaccination dashboard data as of 7 May 2025 shows 2025 uptake mainly among persons aged 65+, though with some younger age-groups taking doses. Dosing in January and February 2025 mostly ranged between 5,000 and 6,000 doses a week.
Persons aged 75+ are recommended to take Covid-19 vaccines every 6 months. All other adults are eligible for annual doses.

Uptake has increased into May 2025, no doubt in preparation for winter. Elderly persons vaccinated for both Covid-19 and flu will likely fare very poorly during winter, and I expect that mid-year deaths will rise to new high levels.

Government recommendations recently excluded healthy children younger than 18 years of age but still include unvaccinated pregnant and breastfeeding women.

Overall, Australians are not very interested in further doses of Covid-19 jabs with only 4.8% having received a dose in the past 6 months, and only 9.6% having received a dose in the past 12 months. Low uptake likely contributes to stabilizing deaths counts.


Australian Population Trending - Births
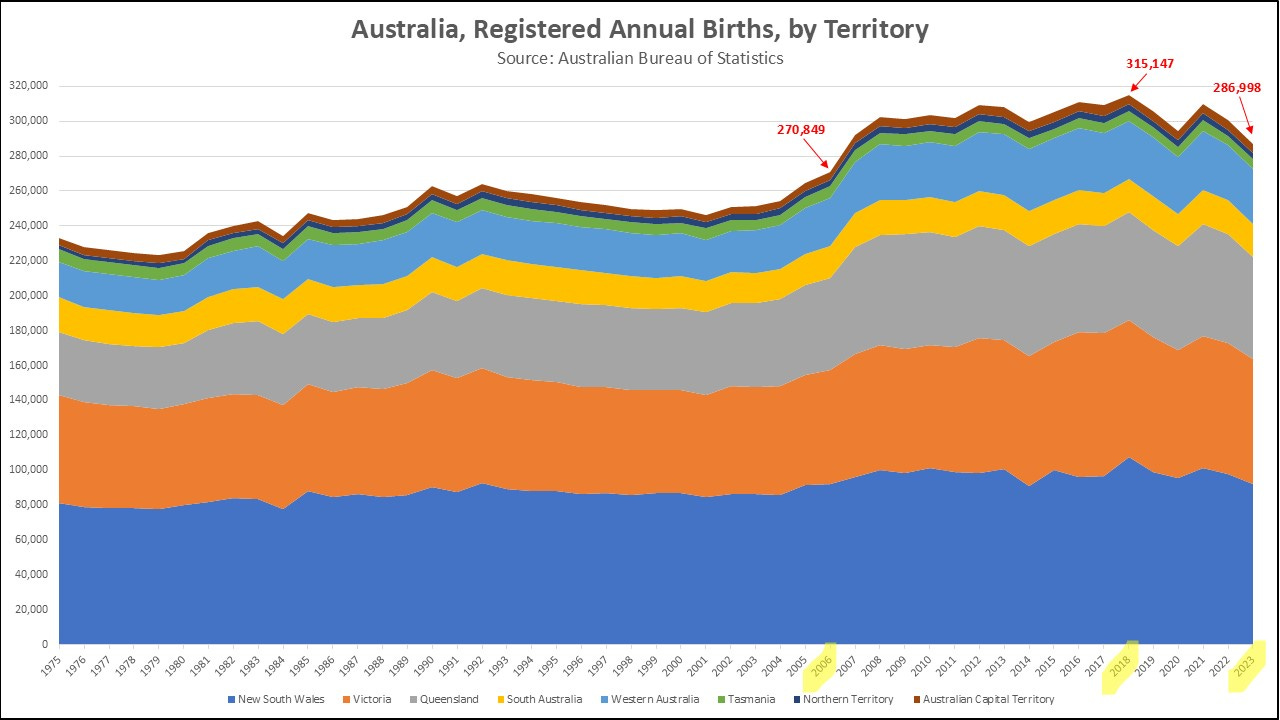
Full year birth data, only available up to 2023, shows declining births and a total fertility rate of 1.5 babies per woman an 8% drop from 2022 when it stood at 1.63.

Birth rates over time since 1975 are plotted. The highest birth year in Australia was 2018 with 315K births. 2023 births have dropped by 8.9% to 287K since 2018 and are at their lowest level since 2006. 2024 birth data will be released in October this year.
Infant Mortality in Post-Pandemic Years Has Risen in All States
Infant mortality (infant deaths / 1000 live births) showed an overall increase of 5.5% between 2018-2020 and 2022-23, reflecting worsening infant outcomes. While this dropped slightly (-2.1%) in the 2023-24 period, Queensland, Western Australia and Tasmania reported their worst outcomes in 2023-2024.

Worsening health outcomes of Australian infants as evidenced by their rising death rates is very concerning for overall population health and wellbeing.
Australian Population Growth
A different report, released on 20 March 2025 and covering the year to September 2024, shows that more than 3/4 of Australia’s population growth is due to migration.

This same release reported 291,200 births (increase of 300 or +0.1% since the previous year), and 187,000 deaths (increase of 3,500 or +1.9% ) in the year to September 2024.
Natural population increase (births-deaths) was 104,200 people, a decrease of 3,200 or 3.0% since the previous year.
Net overseas migration to September 2024 was 379,800 people, a decrease of 176,000 or 31.7% since the same period to September 2023.
Total population increase including natural and migration increases in the year ending September 2024 was 484,000 or 1.8%.

Many question Australia’s migration policies which has resulted in population growth more than 3x the OECD average of 0.523% in 2023, and which has created major challenges for supply and services, infrastructure including housing, and population stability.

About 10% of Australia’s GDP is spent on health, with the average per capita spending on health in 2022–23 being $9,597, to give an estimated total spending of $252.5 billion of which about 1/3 was spent on primary (preventative) health care including vaccines. Referring to mortality data, spending has not translated to better health outcomes / lower deaths.
Next release of ABS data will be on 27 June 2025.
That's very good work, thanks for publishing.
You mention the ABS only reports the last two years data. I presume that all years used to be available B.C. (Before Covid).
I know that Victoria's Registry of Births, Deaths and Marriages showed a significant decline in annual deaths during 2020 when everything was locked down, which of course didn't fit the narrative at all. Their solution was to remove all data but the current year.
So now AC (After Covid) we probably have the same strategy at the ABS.
These stats suggest that the DEADLY mRNA Experimental injections have already killed the most vulnerable and gullible?
Make LIABILITY a legal requirement for makers of uncontrolled and unchecked DEADLY medicines and injections!
Unjabbed Mick (UK) We live longer by distrusting Pharma and their conspiring medics.