Australian Actuaries Play with Numbers to Downplay Ongoing Excess Mortality 1st Quarter 2024. They join the ABS in Creating New Mortality Baselines to Rewrite History from 2022 and Onwards.
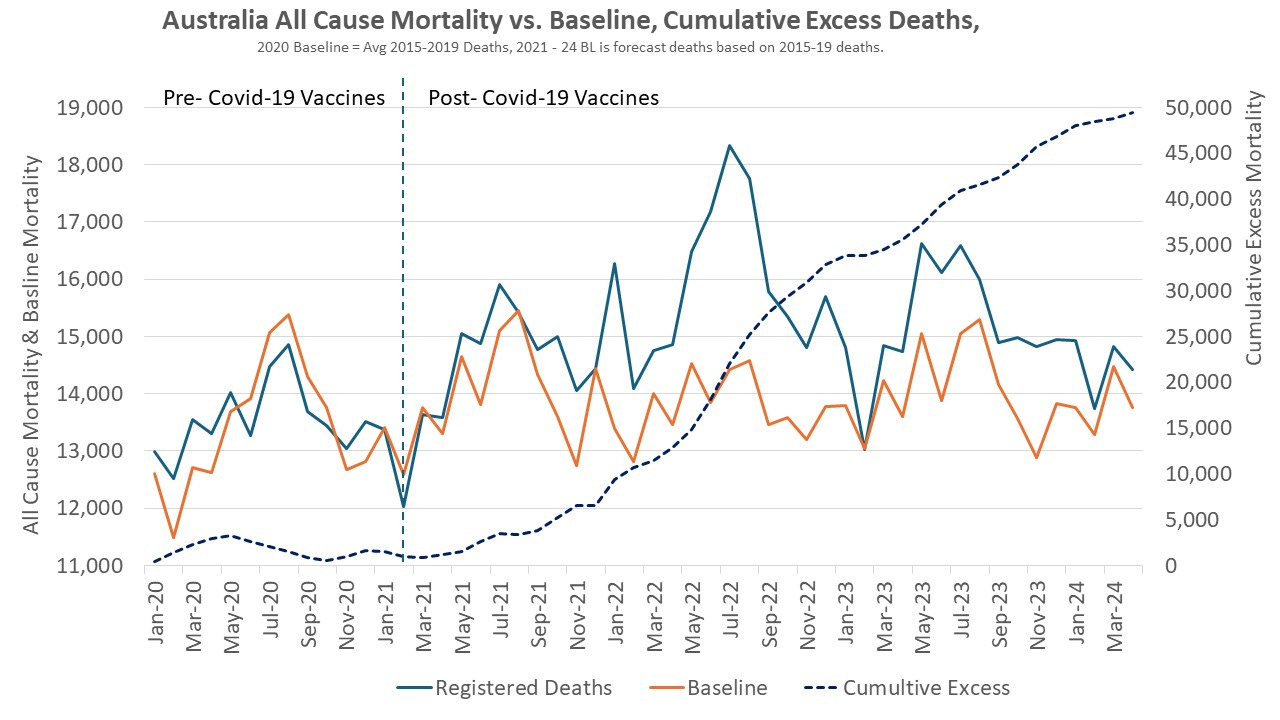
Provisional Jan - April 2024 data (will increase with added delayed registrations) shows continuing mortality well above pre-covid levels; cumulative excess mortality approaching 50,000 Australians!
Australian mortuaries (Mortality Working Group) have put out a report claiming only slight excess mortality of 1% in the first quarter of 2024: never mind that there has been ongoing excess mortality since 2021 which has never yet corrected back to prior levels. The actuaries blame Covid-19 deaths for the 1% rise in 2024 deaths above baseline, for which they have used 2023.
Revisiting 2022 Deaths
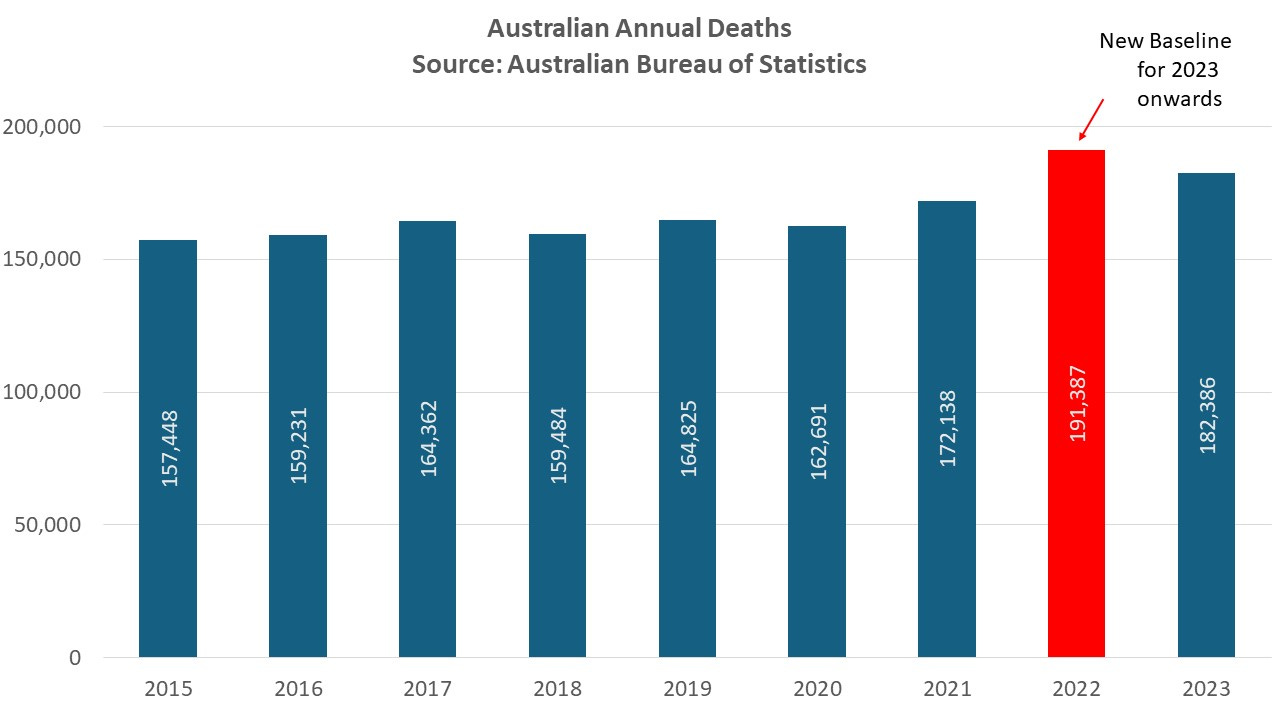
Before looking at the 2024 release, it is important to revisit mortality in 2022, which is the year which is being used as a reference baseline by the Australian Bureau of Statistics. 2020 had no excess mortality and deaths were lower than 2019 levels, despite being the first year of a global pandemic. Deaths rose in 2021, and spiked in 2022.
In 2022, ABS stated that there were 25,551 excess deaths (14.2%) above baseline. A 10% excess deaths is a black swan event! What then is 14.2%? Yet, that 14.2% excess deaths year is the new comparison point for 2023 and 2024 deaths.
ABS Reporting of Excess Deaths for 2020 to 2023
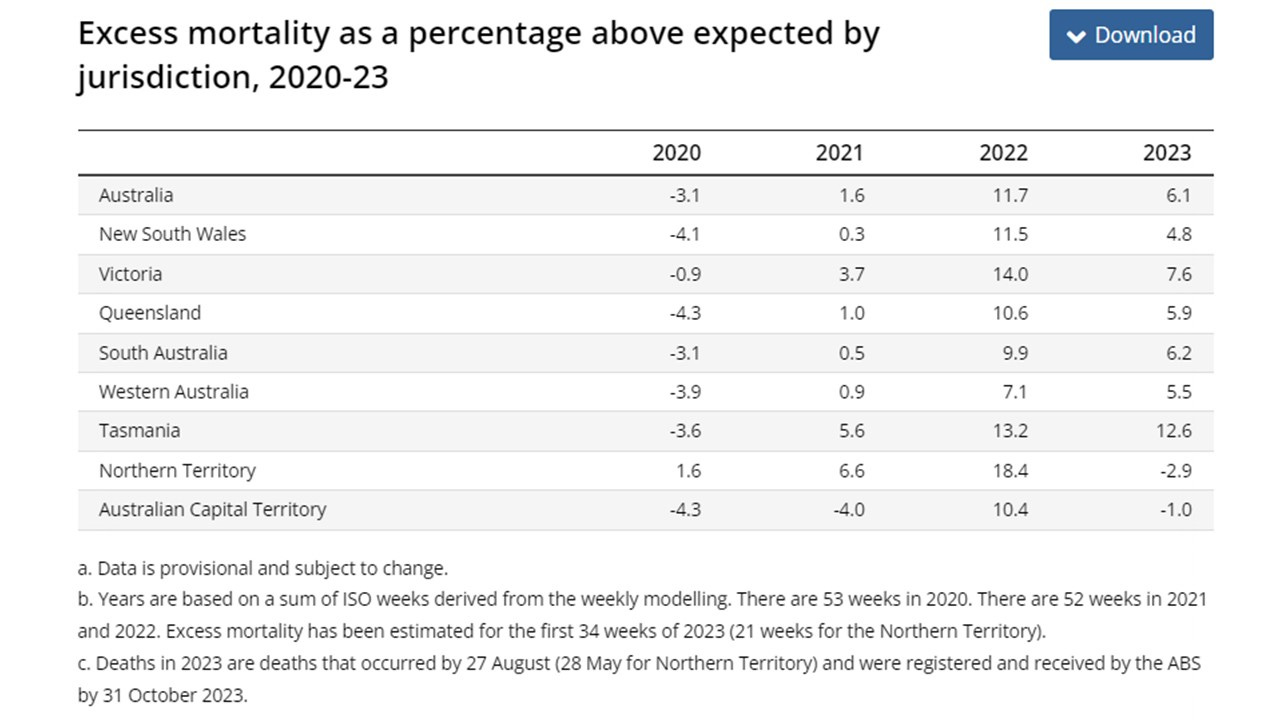
In a report published in December 2023, the ABS reported that as of the end of August 2023, Australia had -3.1% excess deaths in 2020, +1.6% excess deaths in 2021, 11.7% excess deaths in 2022, and 6.1% excess deaths in 2023.
However, they do a cute maneuver where they show that most of the excess deaths were “from or with” Covid-19; red line is deaths unrelated to Covid-19 and only slightly outside the expected range, while yellow line is covid-related, and soars!
This is how the official narrative of deadly Covid-19, and nothing to see with excess deaths is maintained in official government documentation!
ABS Release of Provisional Mortality for January to April 2024
Australian Bureau of Statistics put out their January-April 2024 provisional mortality data on 29th of July 2024. Each subsequent release updates prior months data with new late registrations; January rose by 31 late registrations, February by 49, and March by 115. The new April release of 14,422 deaths could easily rise well above 14,600 once data is completed.
ABS provides an image of weekly deaths compared to 2022 and 2023, and reassures those deaths, while higher than 2023, are lower than 2022. Australia all time high deaths in 2022; comparing 2024 against 2022 is not reassuring.
If a few hundred deaths are added to the provisional data for March and April, deaths in those months will exceed all prior years, and show a disturbing trend of still rising deaths.
To get the historical overview, weekly deaths from 2019 up to April 2024 is plotted. While deaths have come down from the 2022 and 2023 peaks, they are still well above pre-pandemic levels.
Following are deaths by year and month. 2022 had highest recorded deaths in all months except May and November which were exceeded in 2023. March 2024 has exceeded 2022 deaths, and may exceed 2023 deaths once late registration data is compiled.
It is not relevant to compare 2015-2019 data with current data, thus I created a new baseline using the 2015-2019 data to forecast expected deaths1 based on prior trending. Excess deaths based on this forecast model are 49,482 at the end of April 2024. I expect this to continue to rise in coming months.
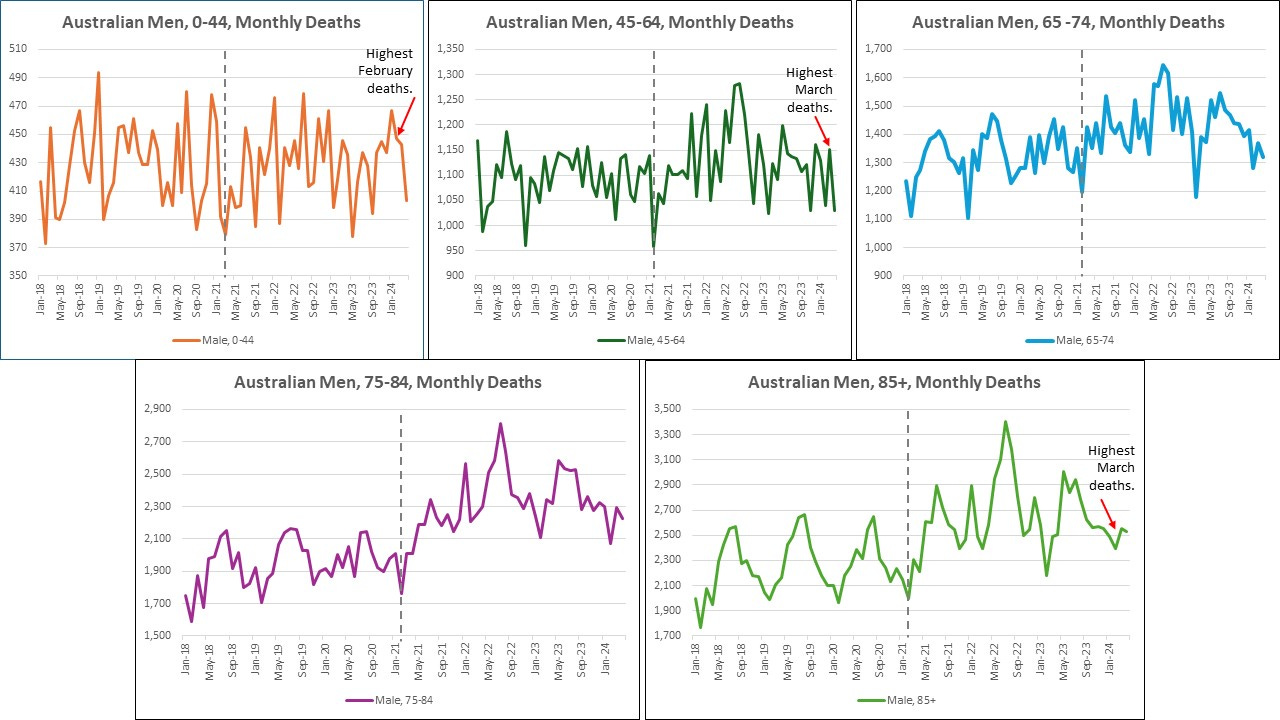
Deaths by gender and age-group are revealing. The patterns of excess deaths which started in 2021 are continuing; 2024 deaths in some months and age groups already exceed the prior highs of 2022.
Lies, damned lies, and statistics! If the Government won’t publish the truth, it is up to the citizen to do it.
We know that life (and data) existed prior to the declared pandemic. Death patterns were very different prior to 2021! We must not forget. We cannot allow history to be rewritten!
Forecast which is a function provided in Microsoft excel.


For New Zealand,I have looked at the 9-year regression, using 2011 to 2019, to extrapolate the eclxpected death rates in 5-year buckets. In nearly every age group, death rates have been declining over that period. It s disingenuous for ABS to use a single year baseline as it hides the trend. Using annual deathbrates I calculated 4000 excess deaths in NZ equating to 20000 in Aus on a population basis. If one uses trends based on weeks, rather than years, the number will be higher, since seasonal death rates are extrapolated. Another criticism of the ABS method, which is also used by the NZ government, is to ignore the effect of border closures. This reduced deaths among the elderly as there was no circulating influenza inthe winters of 202-2022. This reduced the baseline death rate in the Covid years, meaning something else was causing deaths to compensate for these missing deaths and yet there was still 11.7% inceease above the influenza baseline. Also, as seen in NZ, only 45% of Covid deaths are attributable to Covid alone, mainly elderly, and another 20-25% where Covid "contributed". It all depends on how the death certicate is competed. If the docs wan to hide Covid, they can. If they want to hide jab effects, they can. I use my mother as an example; 4 morbidity, including a Coid infection on the Death Certificate.
📘 “Twenty-three-year-old Caitlin Gotze [from Queensland] was fit, strong, and healthy, but 49 days after her second Pfizer injection on 28 September 2021, she was dead.” ~ The Great Vaccine Coverup: Unsafe and Ineffective, by Peter Ralph and Raelene Kennedy (May 2024)- https://www.amazon.com/Great-Vaccine-Coverup-Unsafe-Ineffective-ebook/dp/B0D35K5G4Y/ref=sr_1_1?crid=31URVGT6G4P9W&dib=eyJ2IjoiMSJ9.SmJAyeKs8Lv78930hIslgg.IIZ4OU_EtU1pYfrumBEWKCHXwl8bwxRxvVTzp3P7SJQ&dib_tag=se&keywords=the+great+vaccine+coverup&qid=1721206040&s=digital-text&sprefix=the+great+vaccine+coverup%2Cdigital-text%2C300&sr=1-1&fbclid=IwZXh0bgNhZW0BMQABHT7hAPDApuC6Eb3NzjJIDo7esdaqMj2Ra3gBySzkIsImp-g4o0wryLa5CQ_aem_M-jM0pdcHFz-9a9f0T5AeA