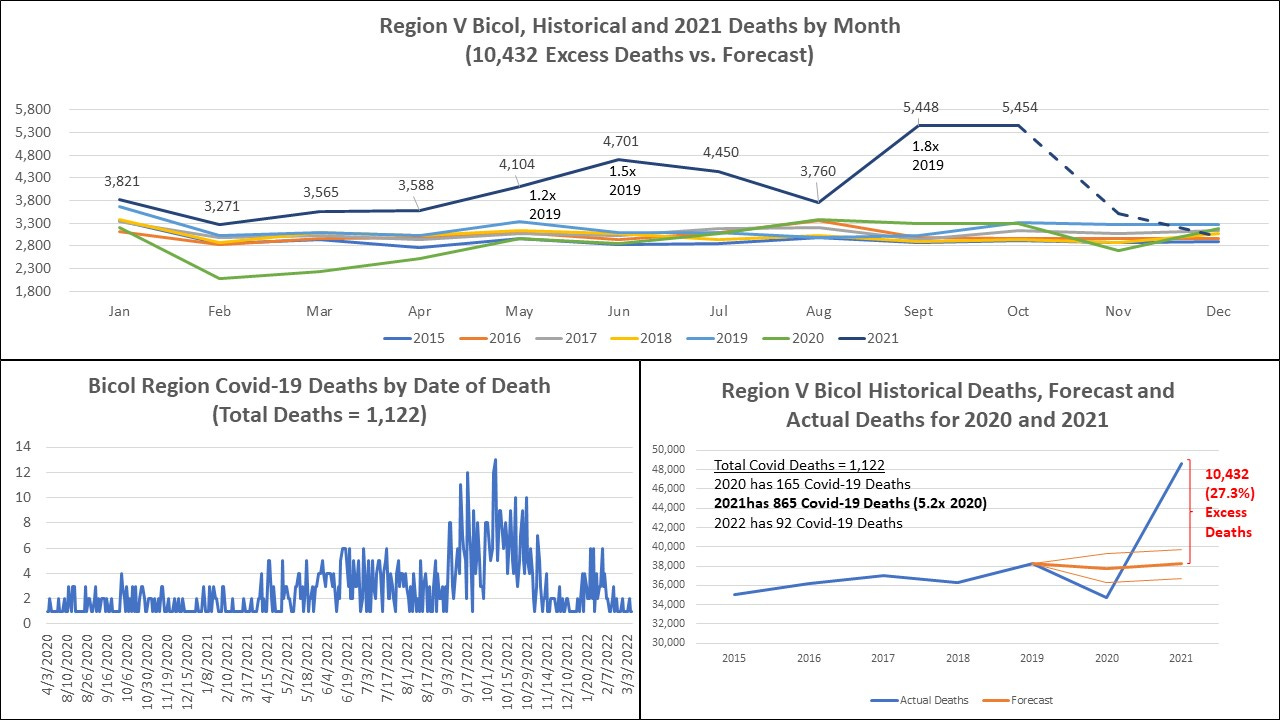
Region V Bicol. 10,432 Excess Deaths (28% Above Forecast Levels) in 2021 vs. 865 Covid-19 Attributed Deaths. Excess Deaths All Started In March to April 2021 And Soared By September.
After no excess deaths in 2020, every single province showed similar patterns of excess deaths starting in March/April and increasing as the year progressed. End of year data is incomplete.
Region V is the Bicol Region, which covers the 6 provinces of Albay, Camarines Norte, Camarines Sur, Catanduanes, Masbate, and Sorsogon. In 2020 its population by Census was 6,082,165, or 5.58% of the entire population of the Philippines.
I have conducted an evaluation of the expected1 and excess2 mortality in Bicol Region. Expected mortality rates for 2020 were calculated using the Excel Forecast tool, using 5-year historical all cause mortality data, and compared against the actual 2020 and 2021 deaths. The excel forecast gives a forecast deaths based on historical patterns and a confidence upper and lower bound. The forecast mortality is a more accurate way to assess actual deaths than simply comparing to one or more previous years, because it is adjusted over time and with reference to typical patterns of deaths. Covid-19 deaths are presented with respect to total and excess deaths in 2020 and 2021. All source data are official public domain Philippines Government data3.
Set out are the all cause mortality, Covid-19 deaths, and forecast vs. actual deaths for the entire Bicol Region. There were no excess deaths in 2020. In 2021 here were 10,432 excess deaths in this region, with most of the excess deaths happening between March and October 2021. These excess deaths are higher by 5.2x than the Covid-19 Deaths. Covid-19 deaths are most typically within the expected deaths because they occur in people with multiple comorbidities and expected limited lifespan (if properly recorded).
Summary of the regional and by province data is set out. The excess deaths exceeded the Covid-19 deaths by 4.7 to 43.2 times. Covid-19 deaths cannot explain the excess deaths even if we assumed (incorrectly) that such deaths were always and only excess. The 2021 excess deaths ranged from 10.2 to 30.2% above the forecast in incomplete data. These percentages could rise much higher when the last quarter data for 2021 is tallied.
Data by province is set out below. After no excess deaths in 2020, Albay had 10.4x more excess deaths than Covid-19 attributed deaths in 2021. Most of these deaths occurred between May and October 2021.
Camarines Norte excess deaths were 36.3x higher than their Covid-19 deaths. Peak deaths in September were double the 2019 levels with 686 deaths compared to 352.
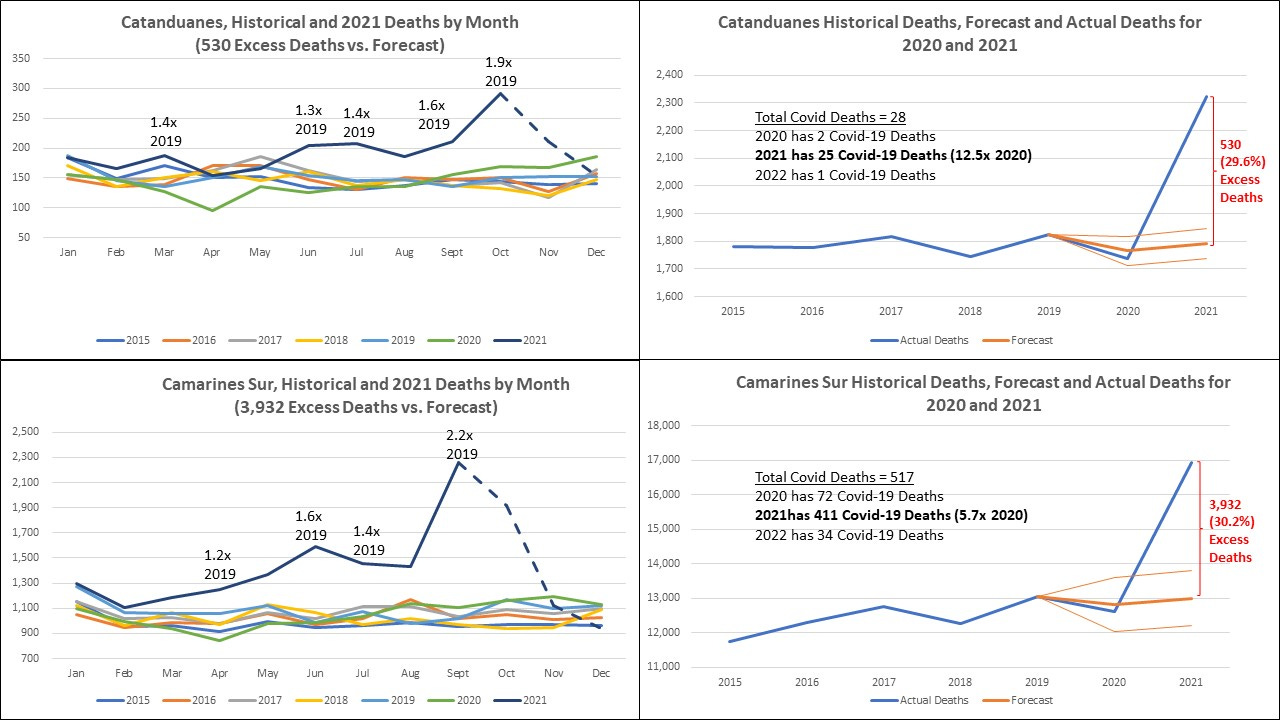
Catanduanes had 530 excess deaths. After a 1.4x spike in March, registered deaths dropped to normal patterns before rising in June and onwards up to September where deaths were 1.9x higher than September 2019. Excess deaths were 29.6% above the forecast levels.
Camarines Sur deaths started rising in March 2021 and kept rising up to June 2021, before soaring to 2.2x normal levels in September after dropping somewhat in July and August. There were 1,242 extra deaths in September 2021 (2,263 deaths vs. 1,021 in 2019). These numbers of premature deaths must be devastating to small communities!
Masbate had a small peak of deaths in March 2021 (concurrent with the first rollout to health care workers and the vulnerable). Deaths dropped in April and then increased through to September when deaths were 2.3x above the 2019 levels. That is 485 extra deaths over and above the 389 deaths that occurred in September 2019. Masbate only had 27 Covid-19 deaths in 2021. The excess deaths exceed the covid-19 deaths by 43.2x!
Sorsagon data for August and September may be incomplete. This pattern may change once the final data for 2021 is released. Sorsagon also has excess deaths in 2021 4.7x higher than their Covid-19 attributed deaths.
HOW IS THIS DO NO HARM? How do the public health measures imposed show benefit over risk when there is this much excess death! The Covid-19 Vaccines were promised as a solution and end to the Covid-19 Pandemic. Instead of solving anything, they have made everything so much worse!
The deaths are just the tip of the ice-berg in terms of injuries, disabilities, suffering, and lost productivity! We have not yet been able to see the full extent of the damage inflicted. This will only become apparent when there is timely and transparent sharing of public health and health outcomes data!
Please review, please share, please ask for answers. Please talk about this!
Expected All Cause Mortality are the normal deaths seen in any population. These are due to aging, accidents, typical illness patterns. Expected mortality is typically stable over time, changing only gradually as the population’s demographics change. Year on year changes are typically only a few low single digit % points.
Excess Mortality: these are deaths higher or above that which is expected from the normal historical trends. Typical causes can be war, natural catastrophe, an outbreak of infectious disease. When vulnerable persons in any place die earlier than expected, their deaths will show as an excess mortality. However, excess mortality is followed by a period of lower than usual mortality, while a new vulnerable population builds up. It is highly unusual for excess mortality in any population to be sustained over a long period. Excess mortality is an excellent indicator of overall population health and well being.
All source data are from official Philippines Government data, taken directly and sorted for presentation. Vital statistics on deaths were taken from Philippines Statistics Authority (psa.gov.ph) public domain data. All Covid-19 death data is taken from the Philippines Department of Health (DOH) Covid-19 Tracker (last data release on 23 July 2022).


When will the DOH take a close look at their data? Hopefully sooner... If only the DOH reads Super Sally's substack, they will become wiser in no time.